HAND_S_52208


Location

lon / lat [deg]: 80.5192 / 26.2856

Source network: AERONET


Geostationary surface albedo (GSA) data


“+000”


“+057/+063”


Landcover information (based on ESA CCI landcover data)


Landcover fractions @ 2km distance


Landcover fractions @ 20 km distance


Legend


Distance to open water bodies [km]:

3.22

Distance to urban areas [km]:

1.59


Radius: 1 km

Number of landcover classes:

1

Dominant landcover type:

20: cropland, irrigated or post-flooded

Fraction of dominant landcover type [%]:

100.0


Radius: 2 km

Number of landcover classes:

2

Dominant landcover type:

20: cropland, irrigated or post-flooded

Fraction of dominant landcover type [%]:

99.0


Radius: 5 km

Number of landcover classes:

4

Dominant landcover type:

20: cropland, irrigated or post-flooded

Fraction of dominant landcover type [%]:

84.0


Radius: 10 km

Number of landcover classes:

3

Dominant landcover type:

20: cropland, irrigated or post-flooded

Fraction of dominant landcover type [%]:

75.0


Radius: 20 km

Number of landcover classes:

3

Dominant landcover type:

20: cropland, irrigated or post-flooded

Fraction of dominant landcover type [%]:

81.0


Disturbances


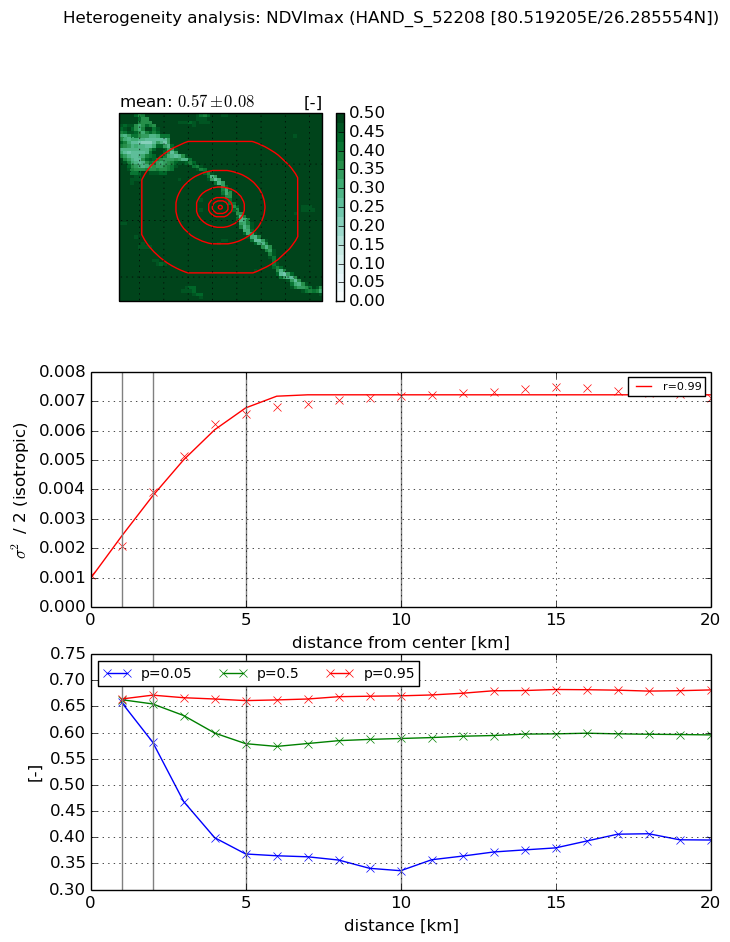
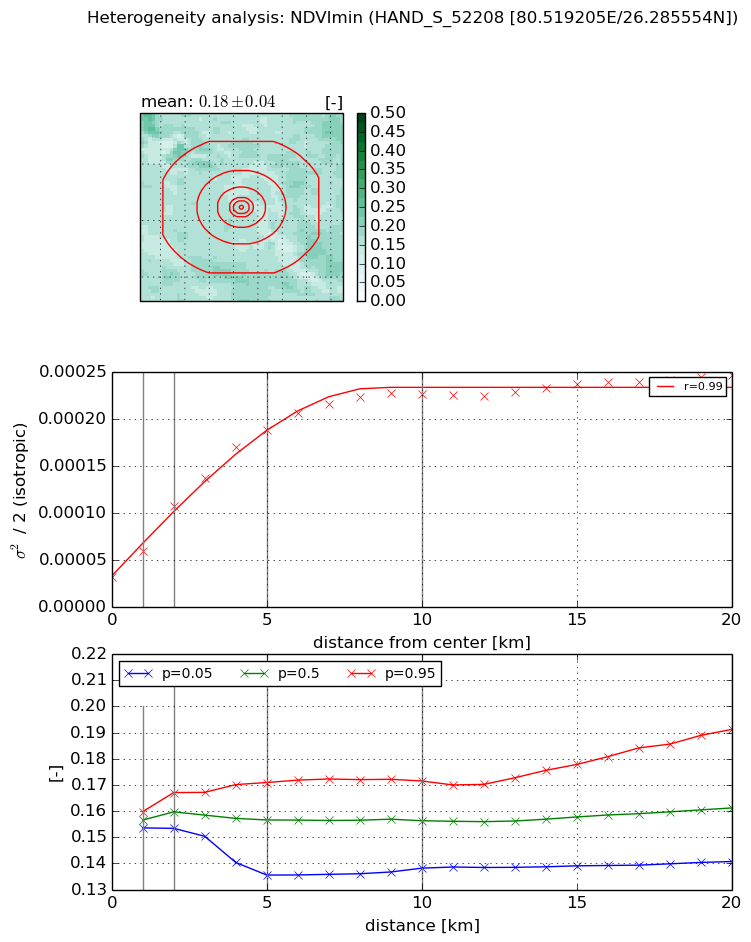
Heterogeneity analysis

The heterogeneity analysis provides information about the spatial and temporal heterogeneity of the site.

Topography


Roman et al. (2009) index


St

1.69363427025

Rcv

0.809789087207

Rse

0.0

Rst

-2.85400581264e-08

Rsv

-0.96154962763


Height range @ 1km [m]

8

Height range @ 2km [m]

8

Height range @ 5km [m]

16

Height range @ 10km [m]

-999

Height range @ 20km [m]

-999


Variance slope @ 1 km

4

Variance slope @ 2 km

4

Variance slope @ 5 km

5

Variance slope @ 10 km

-999

Variance slope @ 20 km

-999


NDVI (max. NDVI composite)


Roman et al. (2009) index


St

3.62441364225

Rcv

0.640350976032

Rse

0.0

Rst

0.0797239340781

Rsv

-0.10764518371


NDVI range @ 1km [-]

0.01

NDVI range @ 2km [-]

0.09

NDVI range @ 5km [-]

0.29

NDVI range @ 10km [-]

0.33

NDVI range @ 20km [-]

0.29


Variance slope @ 1 km

0.00100327306763

Variance slope @ 2 km

0.00141659116054

Variance slope @ 5 km

0.00117269200192

Variance slope @ 10 km

0.000582278543484

Variance slope @ 20 km

0.000214341171602


NDVI (min. NDVI composite)I


Roman et al. (2009) index


St

nan

Rcv

nan

Rse

nan

Rst

nan

Rsv

nan


NDVI range @ 1km [-]

0.01

NDVI range @ 2km [-]

0.01

NDVI range @ 5km [-]

0.04

NDVI range @ 10km [-]

0.03

NDVI range @ 20km [-]

0.05


NDVI slope @ 1 km

2.71843056948e-05

NDVI slope @ 2 km

3.72914513775e-05

NDVI slope @ 5 km

3.25559859147e-05

NDVI slope @ 10 km

1.98561684462e-05

NDVI slope @ 20 km

8.31599236971e-06


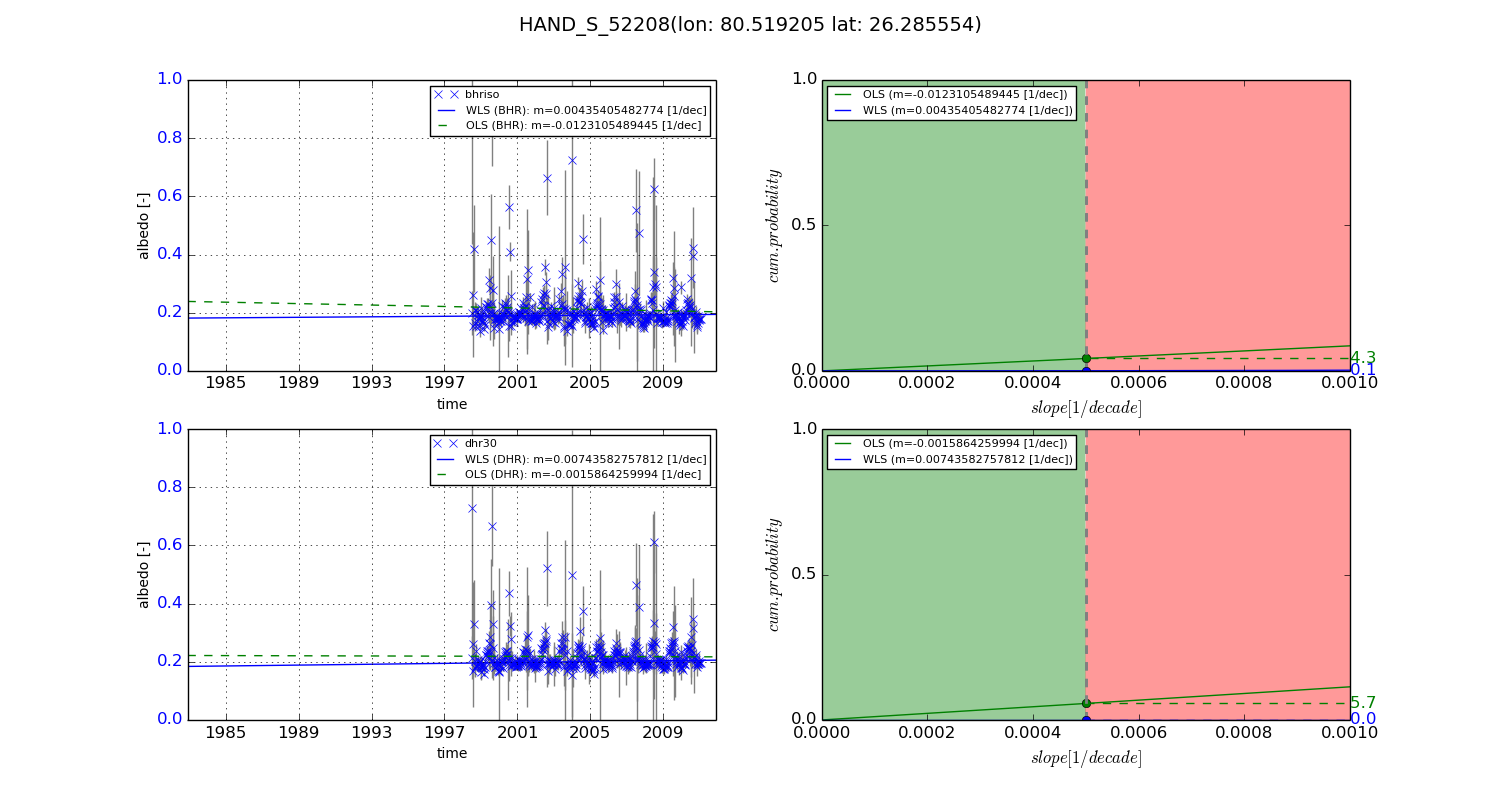
Temporal stability analysis

+000 deg (BHR)


BHR statistics

Temporal stability [1/decade]:


abs

rel


Weighted least square:

None


Ordinary least square:

None


Probabilities that GCOS criteria is met:

Weighted least square:

None %

Ordinary least square:

None %


DHR statistics

Temporal stability [1/decade]:


abs

rel


Weighted least square:

None


Ordinary least square:

None


Probabilities that GCOS criteria is met:

Weighted least square:

None %

Ordinary least square:

None %


+057/+063 deg (BHR)


BHR statistics

Temporal stability [1/decade]:


abs

rel


Weighted least square:

0.00435405482774


Ordinary least square:

-0.0123105489445


Probabilities that GCOS criteria is met:

Weighted least square:

0.1 %

Ordinary least square:

4.3 %


DHR statistics

Temporal stability [1/decade]:


abs

rel


Weighted least square:

0.00743582757812


Ordinary least square:

-0.0015864259994


Probabilities that GCOS criteria is met:

Weighted least square:

0.0 %

Ordinary least square:

5.7 %


Temporal anomaly analyis

The variance of the temporal anomalies provides an additional measure about the stability of the signal AFTER removal of the mean seasonal cylce.

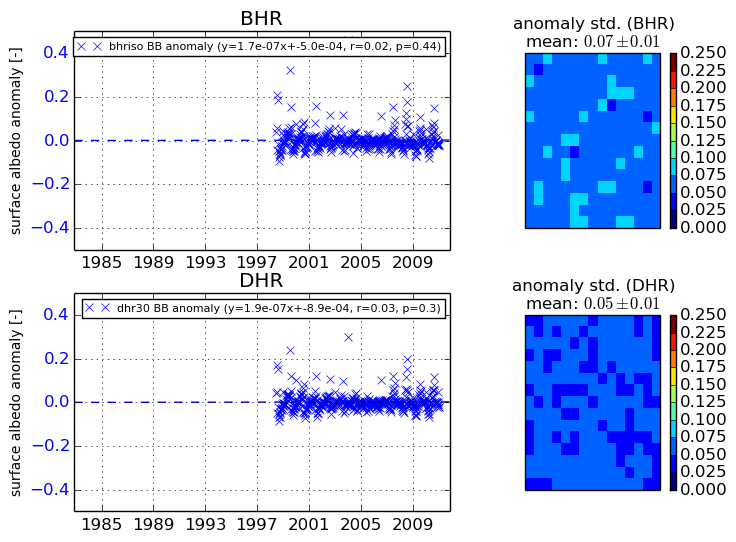
+000 deg


+057/+063 deg