HAND_W_50608


Location

lon / lat [deg]: 80.4631 / 26.3026

Source network: AERONET


Geostationary surface albedo (GSA) data


“+000”


“+057/+063”


Landcover information (based on ESA CCI landcover data)


Landcover fractions @ 2km distance


Landcover fractions @ 20 km distance


Legend


Distance to open water bodies [km]:

7.24

Distance to urban areas [km]:

3.63


Radius: 1 km

Number of landcover classes:

1

Dominant landcover type:

20: cropland, irrigated or post-flooded

Fraction of dominant landcover type [%]:

100.0


Radius: 2 km

Number of landcover classes:

1

Dominant landcover type:

20: cropland, irrigated or post-flooded

Fraction of dominant landcover type [%]:

100.0


Radius: 5 km

Number of landcover classes:

2

Dominant landcover type:

20: cropland, irrigated or post-flooded

Fraction of dominant landcover type [%]:

98.0


Radius: 10 km

Number of landcover classes:

2

Dominant landcover type:

20: cropland, irrigated or post-flooded

Fraction of dominant landcover type [%]:

89.0


Radius: 20 km

Number of landcover classes:

3

Dominant landcover type:

20: cropland, irrigated or post-flooded

Fraction of dominant landcover type [%]:

77.0


Disturbances


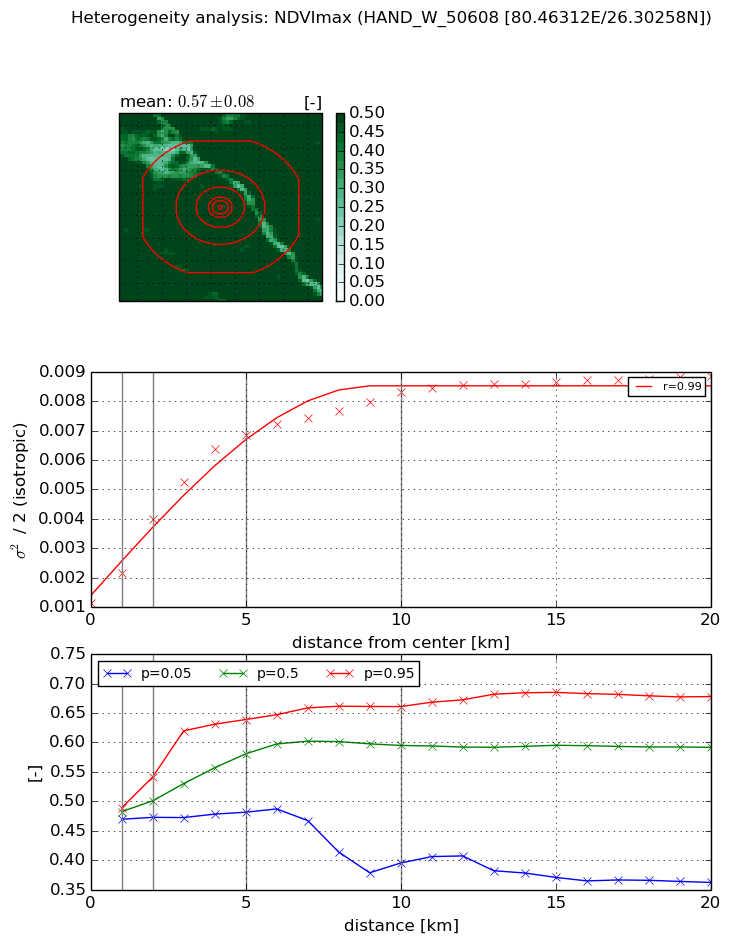
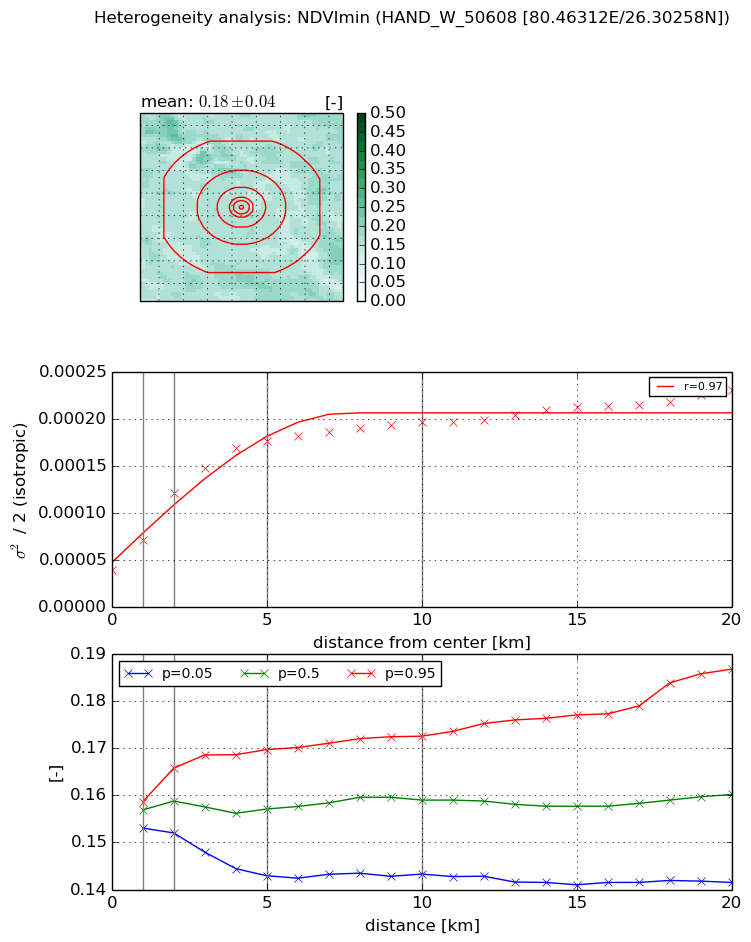
Heterogeneity analysis

The heterogeneity analysis provides information about the spatial and temporal heterogeneity of the site.

Topography


Roman et al. (2009) index


St

nan

Rcv

nan

Rse

nan

Rst

nan

Rsv

nan


Height range @ 1km [m]

4

Height range @ 2km [m]

5

Height range @ 5km [m]

7

Height range @ 10km [m]

-999

Height range @ 20km [m]

-999


Variance slope @ 1 km

1

Variance slope @ 2 km

1

Variance slope @ 5 km

0

Variance slope @ 10 km

-999

Variance slope @ 20 km

-999


NDVI (max. NDVI composite)


Roman et al. (2009) index


St

2.39233871475

Rcv

-0.0714831623498

Rse

0.0

Rst

-0.429155531342

Rsv

0.75336433753


NDVI range @ 1km [-]

0.02

NDVI range @ 2km [-]

0.07

NDVI range @ 5km [-]

0.16

NDVI range @ 10km [-]

0.27

NDVI range @ 20km [-]

0.32


Variance slope @ 1 km

0.00102592821495

Variance slope @ 2 km

0.00143786371166

Variance slope @ 5 km

0.00121604761744

Variance slope @ 10 km

0.000683758590325

Variance slope @ 20 km

0.000303840207678


NDVI (min. NDVI composite)I


Roman et al. (2009) index


St

1.83315648976

Rcv

0.261719271645

Rse

0.0

Rst

-0.374802796514

Rsv

-0.999999427282


NDVI range @ 1km [-]

0.01

NDVI range @ 2km [-]

0.01

NDVI range @ 5km [-]

0.03

NDVI range @ 10km [-]

0.03

NDVI range @ 20km [-]

0.05


NDVI slope @ 1 km

3.14827197094e-05

NDVI slope @ 2 km

4.04696800018e-05

NDVI slope @ 5 km

2.8657080944e-05

NDVI slope @ 10 km

1.42644111291e-05

NDVI slope @ 20 km

6.71563946936e-06


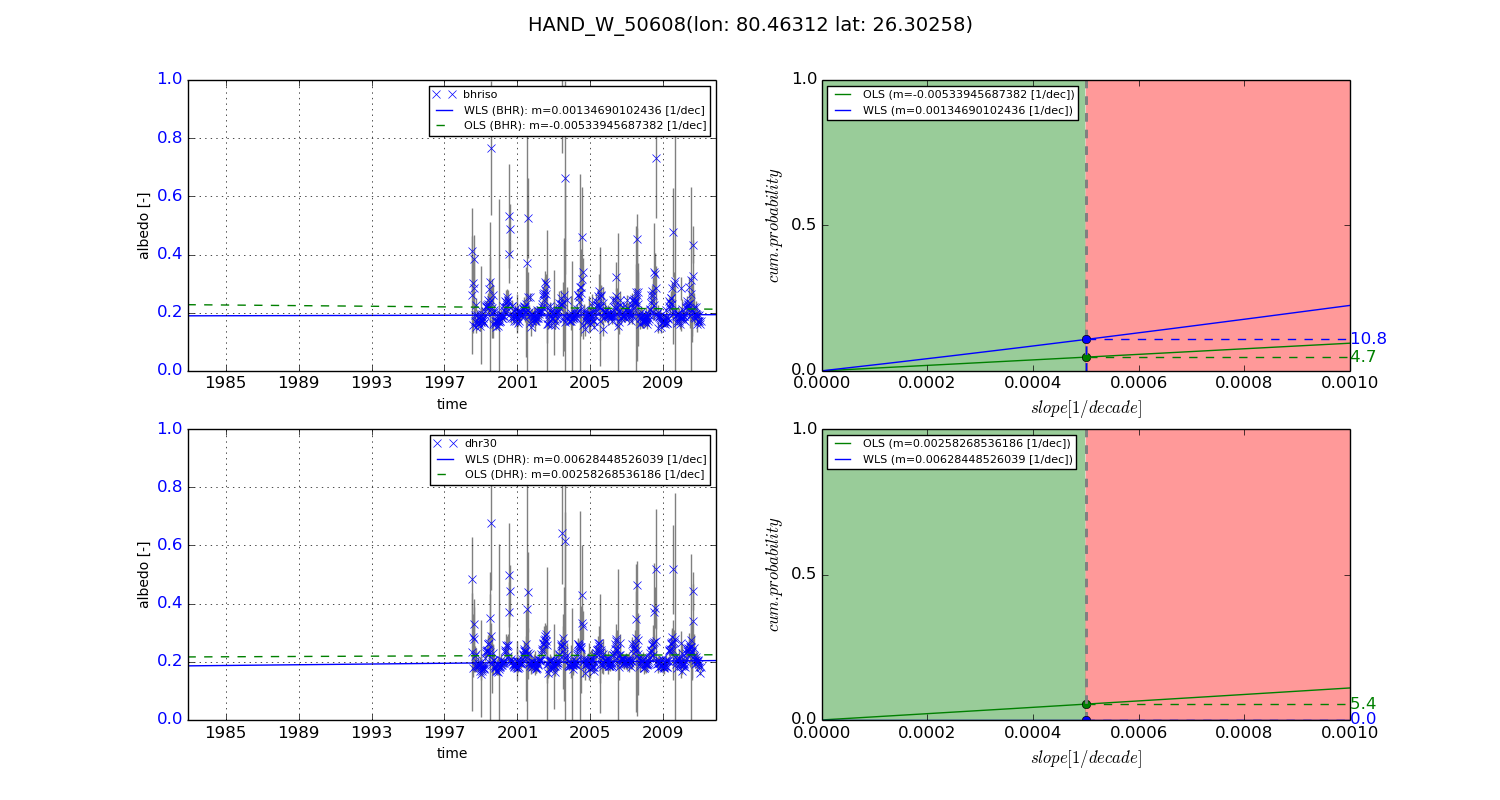
Temporal stability analysis

+000 deg (BHR)


BHR statistics

Temporal stability [1/decade]:


abs

rel


Weighted least square:

None


Ordinary least square:

None


Probabilities that GCOS criteria is met:

Weighted least square:

None %

Ordinary least square:

None %


DHR statistics

Temporal stability [1/decade]:


abs

rel


Weighted least square:

None


Ordinary least square:

None


Probabilities that GCOS criteria is met:

Weighted least square:

None %

Ordinary least square:

None %


+057/+063 deg (BHR)


BHR statistics

Temporal stability [1/decade]:


abs

rel


Weighted least square:

0.00134690102436


Ordinary least square:

-0.00533945687382


Probabilities that GCOS criteria is met:

Weighted least square:

10.8 %

Ordinary least square:

4.7 %


DHR statistics

Temporal stability [1/decade]:


abs

rel


Weighted least square:

0.00628448526039


Ordinary least square:

0.00258268536186


Probabilities that GCOS criteria is met:

Weighted least square:

0.0 %

Ordinary least square:

5.4 %


Temporal anomaly analyis

The variance of the temporal anomalies provides an additional measure about the stability of the signal AFTER removal of the mean seasonal cylce.

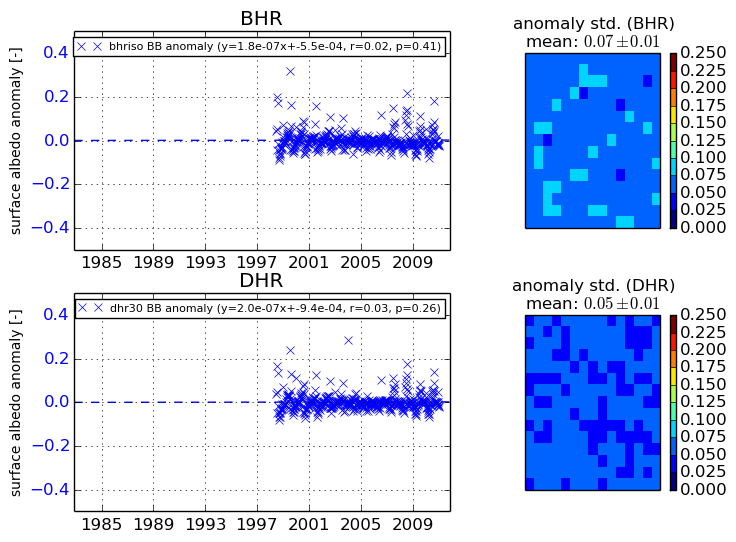
+000 deg


+057/+063 deg