HANGZHOU-ZFU


Location

lon / lat [deg]: 119.7274 / 30.2572

Source network: AERONET


Geostationary surface albedo (GSA) data


“+000”


“+057/+063”


Landcover information (based on ESA CCI landcover data)


Landcover fractions @ 2km distance


Landcover fractions @ 20 km distance


Legend


Distance to open water bodies [km]:

0.97

Distance to urban areas [km]:

0.36


Radius: 1 km

Number of landcover classes:

7

Dominant landcover type:

70: Tree cover, needleleaved, evergreen, closed to open (>15%)

Fraction of dominant landcover type [%]:

38.0


Radius: 2 km

Number of landcover classes:

8

Dominant landcover type:

10: cropland, rainfed

Fraction of dominant landcover type [%]:

33.0


Radius: 5 km

Number of landcover classes:

9

Dominant landcover type:

70: Tree cover, needleleaved, evergreen, closed to open (>15%)

Fraction of dominant landcover type [%]:

21.0


Radius: 10 km

Number of landcover classes:

8

Dominant landcover type:

50: Tree cover, broadleaved, evergreen, closed to open (>15%)

Fraction of dominant landcover type [%]:

23.0


Radius: 20 km

Number of landcover classes:

8

Dominant landcover type:

50: Tree cover, broadleaved, evergreen, closed to open (>15%)

Fraction of dominant landcover type [%]:

37.0


Disturbances


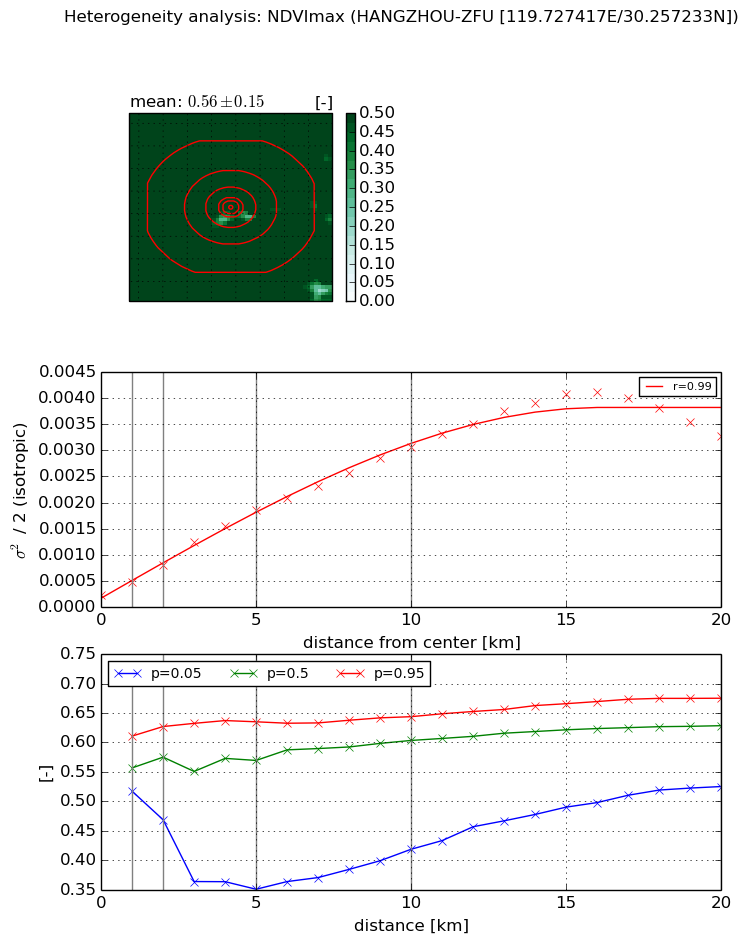
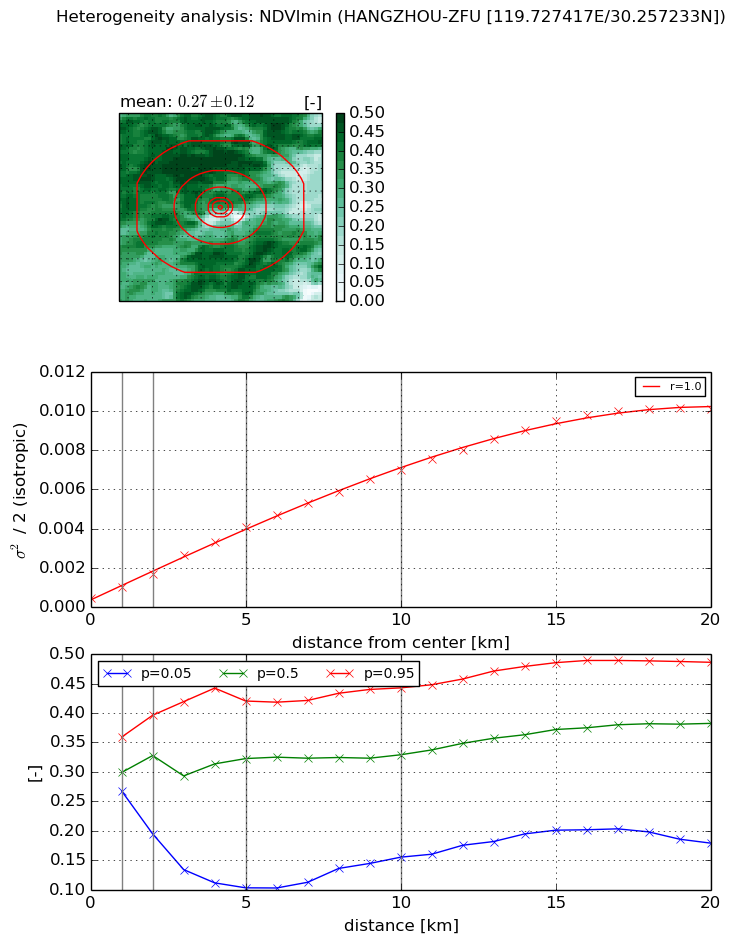
Heterogeneity analysis

The heterogeneity analysis provides information about the spatial and temporal heterogeneity of the site.

Topography


Roman et al. (2009) index


St

3.58176351849e-11

Rcv

0.01834324342

Rse

0.0

Rst

-0.164512319624

Rsv

83757623430.8


Height range @ 1km [m]

99

Height range @ 2km [m]

130

Height range @ 5km [m]

201

Height range @ 10km [m]

-999

Height range @ 20km [m]

-999


Variance slope @ 1 km

1833

Variance slope @ 2 km

1479

Variance slope @ 5 km

600

Variance slope @ 10 km

-999

Variance slope @ 20 km

-999


NDVI (max. NDVI composite)


Roman et al. (2009) index


St

1.04675321481

Rcv

0.106748576288

Rse

0.0

Rst

-3.13905628859e-09

Rsv

2.75925647082


NDVI range @ 1km [-]

0.09

NDVI range @ 2km [-]

0.16

NDVI range @ 5km [-]

0.28

NDVI range @ 10km [-]

0.23

NDVI range @ 20km [-]

0.15


Variance slope @ 1 km

0.000247500483467

Variance slope @ 2 km

0.000284929966345

Variance slope @ 5 km

0.000336623858898

Variance slope @ 10 km

0.000286621882435

Variance slope @ 20 km

0.00018405999334


NDVI (min. NDVI composite)I


Roman et al. (2009) index


St

1.42026061556e-07

Rcv

0.100542984632

Rse

0.0

Rst

0.183053334469

Rsv

21122883.5529


NDVI range @ 1km [-]

0.09

NDVI range @ 2km [-]

0.2

NDVI range @ 5km [-]

0.32

NDVI range @ 10km [-]

0.29

NDVI range @ 20km [-]

0.31


NDVI slope @ 1 km

0.000534751564857

NDVI slope @ 2 km

0.00061598480886

NDVI slope @ 5 km

0.000745458988535

NDVI slope @ 10 km

0.000670815699141

NDVI slope @ 20 km

0.000513824328032


Temporal stability analysis

+000 deg (BHR)


BHR statistics

Temporal stability [1/decade]:


abs

rel


Weighted least square:

None


Ordinary least square:

None


Probabilities that GCOS criteria is met:

Weighted least square:

None %

Ordinary least square:

None %


DHR statistics

Temporal stability [1/decade]:


abs

rel


Weighted least square:

None


Ordinary least square:

None


Probabilities that GCOS criteria is met:

Weighted least square:

None %

Ordinary least square:

None %


+057/+063 deg (BHR)


BHR statistics

Temporal stability [1/decade]:


abs

rel


Weighted least square:

-99999.0


Ordinary least square:

-99999.0


Probabilities that GCOS criteria is met:

Weighted least square:

-99999.0 %

Ordinary least square:

-99999.0 %


DHR statistics

Temporal stability [1/decade]:


abs

rel


Weighted least square:

-99999.0


Ordinary least square:

-99999.0


Probabilities that GCOS criteria is met:

Weighted least square:

-99999.0 %

Ordinary least square:

-99999.0 %


Temporal anomaly analyis

The variance of the temporal anomalies provides an additional measure about the stability of the signal AFTER removal of the mean seasonal cylce.

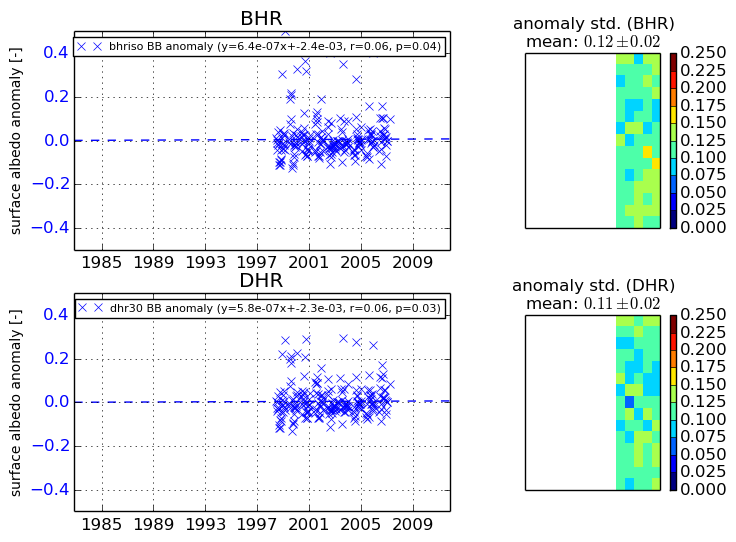
+000 deg


+057/+063 deg