HARVARD_FOREST_LTER_HFR


Location

lon / lat [deg]: -72.19 / 42.53

Source network: LTER


Geostationary surface albedo (GSA) data


“+000”


“+057/+063”


Landcover information (based on ESA CCI landcover data)


Landcover fractions @ 2km distance


Landcover fractions @ 20 km distance


Legend


Distance to open water bodies [km]:

1.73

Distance to urban areas [km]:

0.58


Radius: 1 km

Number of landcover classes:

4

Dominant landcover type:

61: Tree cover, broadleaved, decidous (closed > 40%)

Fraction of dominant landcover type [%]:

70.0


Radius: 2 km

Number of landcover classes:

7

Dominant landcover type:

61: Tree cover, broadleaved, decidous (closed > 40%)

Fraction of dominant landcover type [%]:

58.0


Radius: 5 km

Number of landcover classes:

7

Dominant landcover type:

61: Tree cover, broadleaved, decidous (closed > 40%)

Fraction of dominant landcover type [%]:

57.0


Radius: 10 km

Number of landcover classes:

7

Dominant landcover type:

61: Tree cover, broadleaved, decidous (closed > 40%)

Fraction of dominant landcover type [%]:

43.0


Radius: 20 km

Number of landcover classes:

7

Dominant landcover type:

61: Tree cover, broadleaved, decidous (closed > 40%)

Fraction of dominant landcover type [%]:

29.0


Disturbances


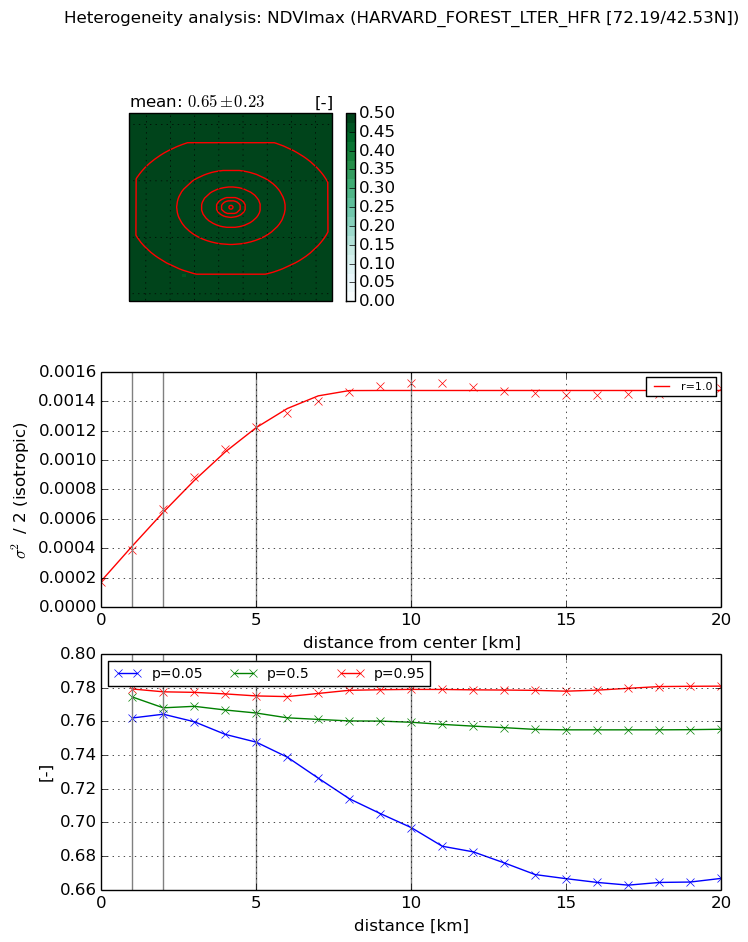
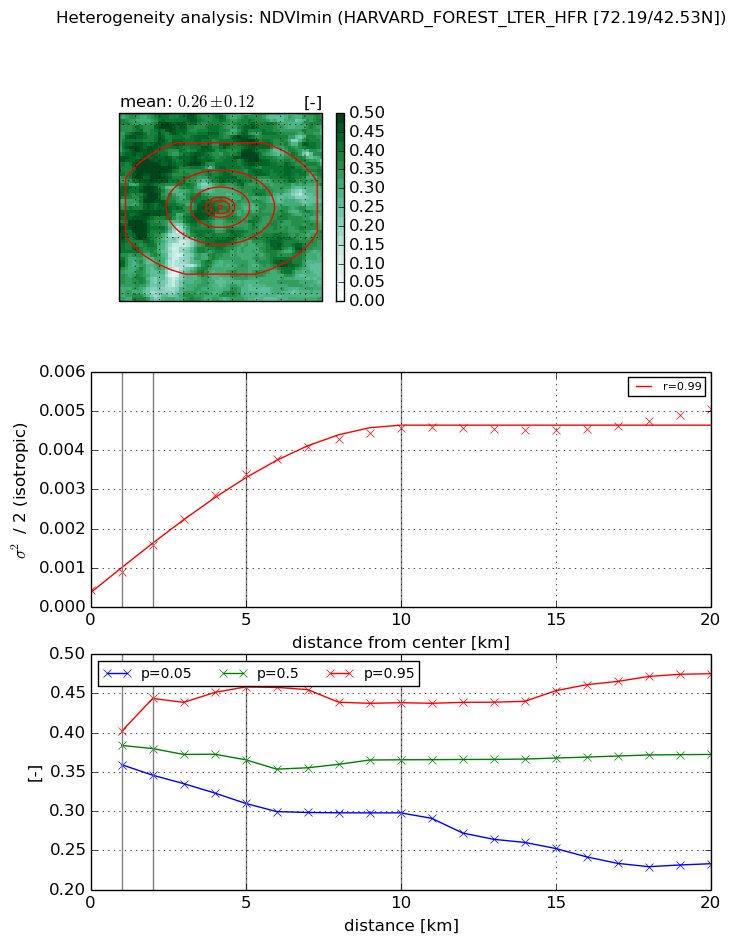
Heterogeneity analysis

The heterogeneity analysis provides information about the spatial and temporal heterogeneity of the site.

Topography


Roman et al. (2009) index


St

3.31934807954

Rcv

0.12780692629

Rse

0.0

Rst

-0.102548478459

Rsv

-0.673436523098


Height range @ 1km [m]

95

Height range @ 2km [m]

127

Height range @ 5km [m]

150

Height range @ 10km [m]

-999

Height range @ 20km [m]

-999


Variance slope @ 1 km

531

Variance slope @ 2 km

565

Variance slope @ 5 km

497

Variance slope @ 10 km

-999

Variance slope @ 20 km

-999


NDVI (max. NDVI composite)


Roman et al. (2009) index


St

1.81926660483

Rcv

0.743849962605

Rse

0.0

Rst

-0.508428744547

Rsv

0.39673743597


NDVI range @ 1km [-]

0.02

NDVI range @ 2km [-]

0.01

NDVI range @ 5km [-]

0.03

NDVI range @ 10km [-]

0.08

NDVI range @ 20km [-]

0.11


Variance slope @ 1 km

0.000213446012752

Variance slope @ 2 km

0.000245290153783

Variance slope @ 5 km

0.000215373271702

Variance slope @ 10 km

0.000135528162078

Variance slope @ 20 km

4.83119461848e-05


NDVI (min. NDVI composite)I


Roman et al. (2009) index


St

2.99434740807

Rcv

0.370952059544

Rse

0.0

Rst

-0.189799038859

Rsv

0.441136655809


NDVI range @ 1km [-]

0.04

NDVI range @ 2km [-]

0.1

NDVI range @ 5km [-]

0.15

NDVI range @ 10km [-]

0.14

NDVI range @ 20km [-]

0.24


NDVI slope @ 1 km

0.00047936472598

NDVI slope @ 2 km

0.000582378861145

NDVI slope @ 5 km

0.000611388516494

NDVI slope @ 10 km

0.000433295038003

NDVI slope @ 20 km

0.00018820262356


Temporal stability analysis

+000 deg (BHR)


BHR statistics

Temporal stability [1/decade]:


abs

rel


Weighted least square:

-99999.0


Ordinary least square:

-99999.0


Probabilities that GCOS criteria is met:

Weighted least square:

-99999.0 %

Ordinary least square:

-99999.0 %


DHR statistics

Temporal stability [1/decade]:


abs

rel


Weighted least square:

-99999.0


Ordinary least square:

-99999.0


Probabilities that GCOS criteria is met:

Weighted least square:

-99999.0 %

Ordinary least square:

-99999.0 %


+057/+063 deg (BHR)


BHR statistics

Temporal stability [1/decade]:


abs

rel


Weighted least square:

None


Ordinary least square:

None


Probabilities that GCOS criteria is met:

Weighted least square:

None %

Ordinary least square:

None %


DHR statistics

Temporal stability [1/decade]:


abs

rel


Weighted least square:

None


Ordinary least square:

None


Probabilities that GCOS criteria is met:

Weighted least square:

None %

Ordinary least square:

None %


Temporal anomaly analyis

The variance of the temporal anomalies provides an additional measure about the stability of the signal AFTER removal of the mean seasonal cylce.

+000 deg


+057/+063 deg