HEFEI


Location

lon / lat [deg]: 117.1622 / 31.9047

Source network: AERONET


Geostationary surface albedo (GSA) data


“+000”


“+057/+063”


Landcover information (based on ESA CCI landcover data)


Landcover fractions @ 2km distance


Landcover fractions @ 20 km distance


Legend


Distance to open water bodies [km]:

0.07

Distance to urban areas [km]:

0.56


Radius: 1 km

Number of landcover classes:

4

Dominant landcover type:

210: water bodies

Fraction of dominant landcover type [%]:

81.0


Radius: 2 km

Number of landcover classes:

5

Dominant landcover type:

210: water bodies

Fraction of dominant landcover type [%]:

69.0


Radius: 5 km

Number of landcover classes:

6

Dominant landcover type:

20: cropland, irrigated or post-flooded

Fraction of dominant landcover type [%]:

37.0


Radius: 10 km

Number of landcover classes:

7

Dominant landcover type:

20: cropland, irrigated or post-flooded

Fraction of dominant landcover type [%]:

35.0


Radius: 20 km

Number of landcover classes:

6

Dominant landcover type:

20: cropland, irrigated or post-flooded

Fraction of dominant landcover type [%]:

35.0


Disturbances


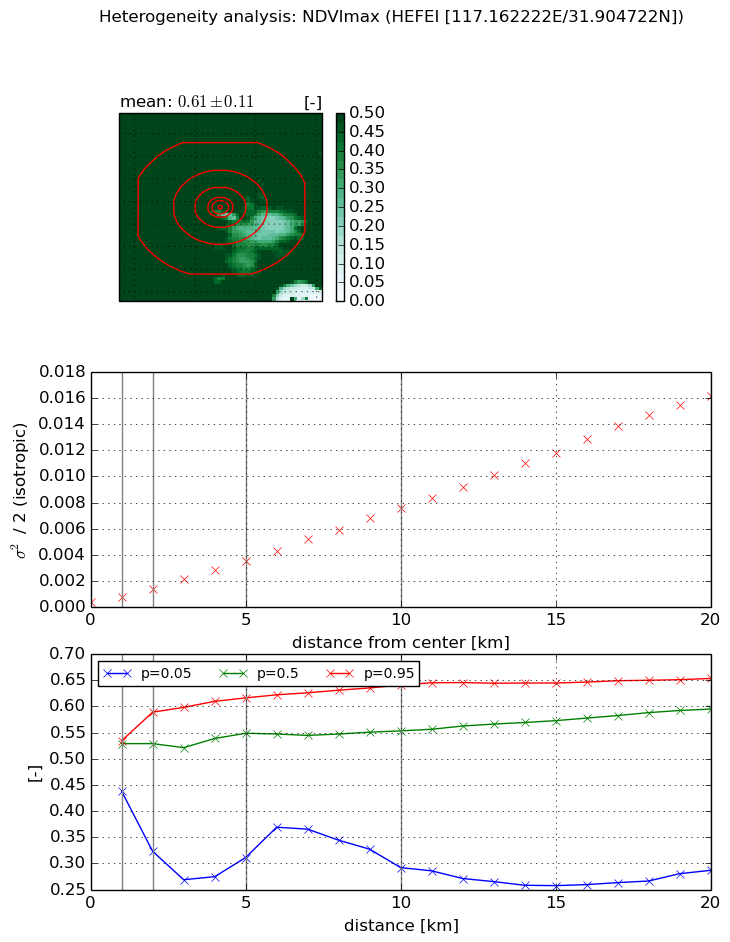
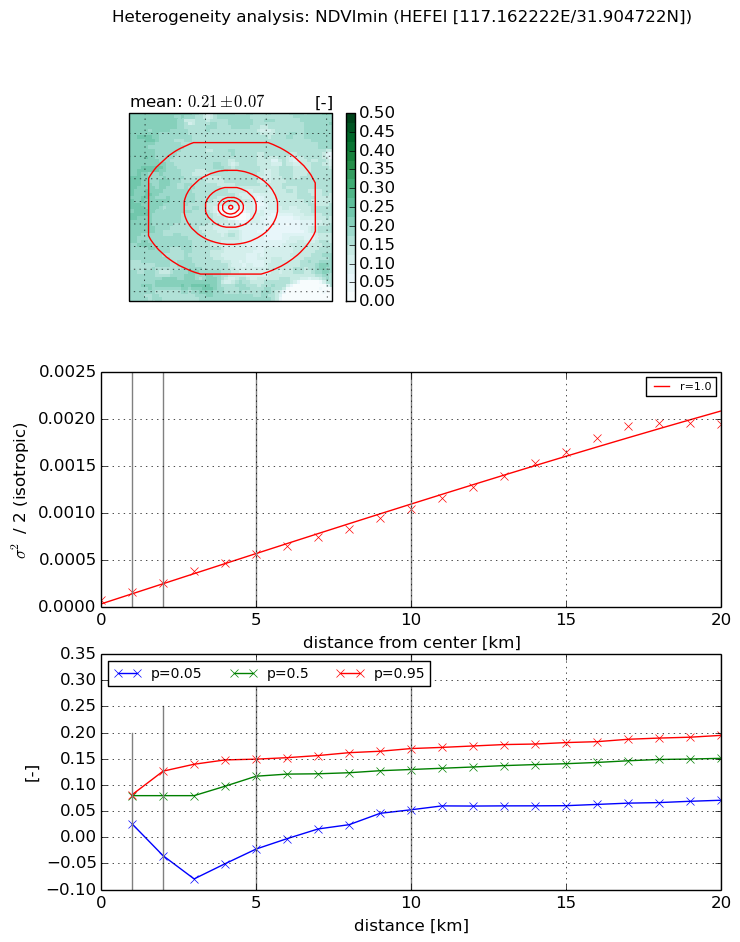
Heterogeneity analysis

The heterogeneity analysis provides information about the spatial and temporal heterogeneity of the site.

Topography


Roman et al. (2009) index


St

2.19362704363

Rcv

0.162418176507

Rse

0.0

Rst

0.0793797762103

Rsv

1.1258000666


Height range @ 1km [m]

15

Height range @ 2km [m]

16

Height range @ 5km [m]

23

Height range @ 10km [m]

-999

Height range @ 20km [m]

-999


Variance slope @ 1 km

23

Variance slope @ 2 km

16

Variance slope @ 5 km

15

Variance slope @ 10 km

-999

Variance slope @ 20 km

-999


NDVI (max. NDVI composite)


Roman et al. (2009) index


St

6.83429504717

Rcv

-0.134664453033

Rse

0.0

Rst

-0.033366290248

Rsv

0.270931867975


NDVI range @ 1km [-]

0.1

NDVI range @ 2km [-]

0.27

NDVI range @ 5km [-]

0.31

NDVI range @ 10km [-]

0.35

NDVI range @ 20km [-]

0.37


Variance slope @ 1 km

0.00044122292454

Variance slope @ 2 km

0.000503010691622

Variance slope @ 5 km

0.00064907888095

Variance slope @ 10 km

0.000739657557784

Variance slope @ 20 km

0.000816410926871


NDVI (min. NDVI composite)I


Roman et al. (2009) index


St

4.61356416893

Rcv

-0.391583863741

Rse

0.0

Rst

0.139887708648

Rsv

-0.118784908317


NDVI range @ 1km [-]

0.06

NDVI range @ 2km [-]

0.16

NDVI range @ 5km [-]

0.17

NDVI range @ 10km [-]

0.12

NDVI range @ 20km [-]

0.12


NDVI slope @ 1 km

8.26259628082e-05

NDVI slope @ 2 km

9.2107019749e-05

NDVI slope @ 5 km

0.000100526418525

NDVI slope @ 10 km

9.65243218469e-05

NDVI slope @ 20 km

0.000102913262189


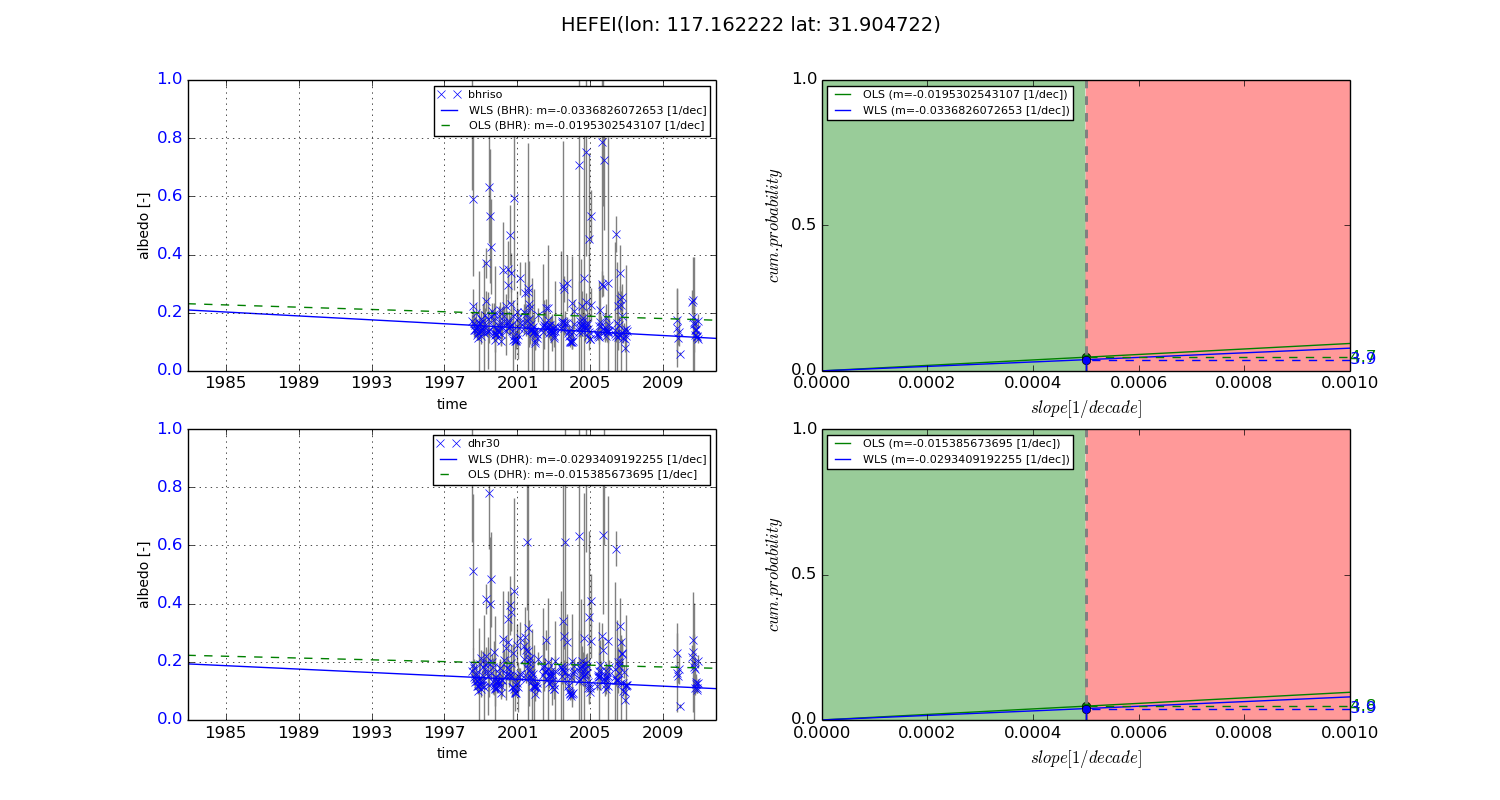
Temporal stability analysis

+000 deg (BHR)


BHR statistics

Temporal stability [1/decade]:


abs

rel


Weighted least square:

None


Ordinary least square:

None


Probabilities that GCOS criteria is met:

Weighted least square:

None %

Ordinary least square:

None %


DHR statistics

Temporal stability [1/decade]:


abs

rel


Weighted least square:

None


Ordinary least square:

None


Probabilities that GCOS criteria is met:

Weighted least square:

None %

Ordinary least square:

None %


+057/+063 deg (BHR)


BHR statistics

Temporal stability [1/decade]:


abs

rel


Weighted least square:

-0.0336826072653


Ordinary least square:

-0.0195302543107


Probabilities that GCOS criteria is met:

Weighted least square:

3.9 %

Ordinary least square:

4.7 %


DHR statistics

Temporal stability [1/decade]:


abs

rel


Weighted least square:

-0.0293409192255


Ordinary least square:

-0.015385673695


Probabilities that GCOS criteria is met:

Weighted least square:

3.9 %

Ordinary least square:

4.8 %


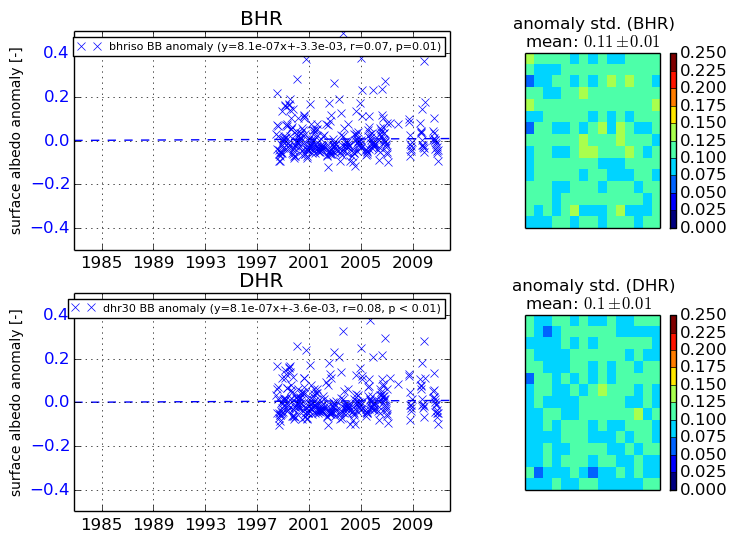
Temporal anomaly analyis

The variance of the temporal anomalies provides an additional measure about the stability of the signal AFTER removal of the mean seasonal cylce.

+000 deg


+057/+063 deg