HERMOSILLO


Location

lon / lat [deg]: -110.96 / 29.0747

Source network: AERONET


Geostationary surface albedo (GSA) data


“+000”


“+057/+063”


Landcover information (based on ESA CCI landcover data)


Landcover fractions @ 2km distance


Landcover fractions @ 20 km distance


Legend


Distance to open water bodies [km]:

3.62

Distance to urban areas [km]:

0.13


Radius: 1 km

Number of landcover classes:

1

Dominant landcover type:

190: urban areas

Fraction of dominant landcover type [%]:

100.0


Radius: 2 km

Number of landcover classes:

2

Dominant landcover type:

190: urban areas

Fraction of dominant landcover type [%]:

97.0


Radius: 5 km

Number of landcover classes:

3

Dominant landcover type:

190: urban areas

Fraction of dominant landcover type [%]:

80.0


Radius: 10 km

Number of landcover classes:

4

Dominant landcover type:

120: Shrubland

Fraction of dominant landcover type [%]:

47.0


Radius: 20 km

Number of landcover classes:

5

Dominant landcover type:

120: Shrubland

Fraction of dominant landcover type [%]:

82.0


Disturbances


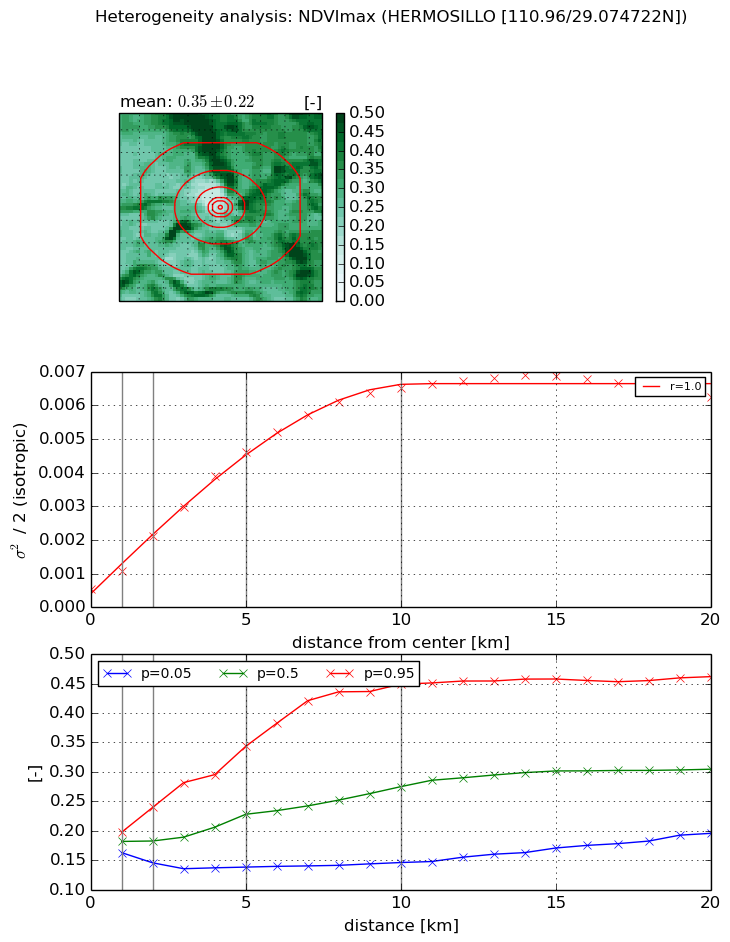
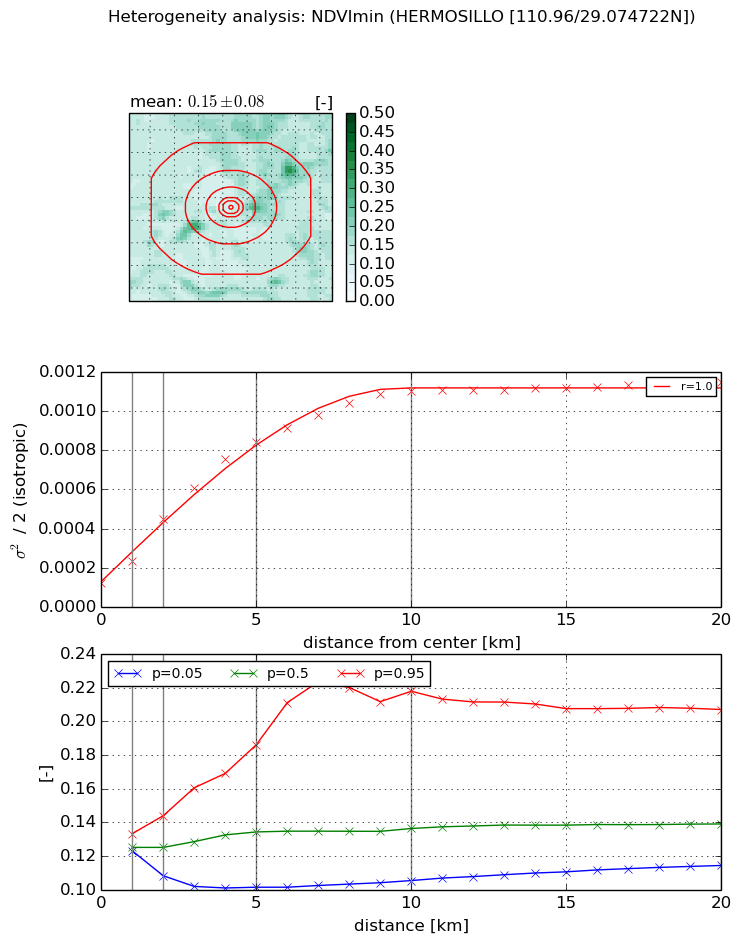
Heterogeneity analysis

The heterogeneity analysis provides information about the spatial and temporal heterogeneity of the site.

Topography


Roman et al. (2009) index


St

7.39673341048

Rcv

-0.121849893954

Rse

0.0

Rst

-0.0724218542032

Rsv

0.211312694801


Height range @ 1km [m]

37

Height range @ 2km [m]

37

Height range @ 5km [m]

88

Height range @ 10km [m]

-999

Height range @ 20km [m]

-999


Variance slope @ 1 km

355

Variance slope @ 2 km

292

Variance slope @ 5 km

196

Variance slope @ 10 km

-999

Variance slope @ 20 km

-999


NDVI (max. NDVI composite)


Roman et al. (2009) index


St

0.366456169103

Rcv

0.295615806475

Rse

0.0

Rst

0.150893242524

Rsv

7.74000888395


NDVI range @ 1km [-]

0.03

NDVI range @ 2km [-]

0.09

NDVI range @ 5km [-]

0.21

NDVI range @ 10km [-]

0.3

NDVI range @ 20km [-]

0.27


Variance slope @ 1 km

0.000519252409415

Variance slope @ 2 km

0.000776801038789

Variance slope @ 5 km

0.000847057071721

Variance slope @ 10 km

0.000635089434415

Variance slope @ 20 km

0.00026823060384


NDVI (min. NDVI composite)I


Roman et al. (2009) index


St

1.02789914926

Rcv

0.478428245407

Rse

0.0

Rst

0.124969469523

Rsv

2.31517654614


NDVI range @ 1km [-]

0.01

NDVI range @ 2km [-]

0.04

NDVI range @ 5km [-]

0.08

NDVI range @ 10km [-]

0.11

NDVI range @ 20km [-]

0.09


NDVI slope @ 1 km

0.000113026354973

NDVI slope @ 2 km

0.000161756193123

NDVI slope @ 5 km

0.000151634611958

NDVI slope @ 10 km

9.96892325035e-05

NDVI slope @ 20 km

4.23035302044e-05


Temporal stability analysis

+000 deg (BHR)


BHR statistics

Temporal stability [1/decade]:


abs

rel


Weighted least square:

None


Ordinary least square:

None


Probabilities that GCOS criteria is met:

Weighted least square:

None %

Ordinary least square:

None %


DHR statistics

Temporal stability [1/decade]:


abs

rel


Weighted least square:

None


Ordinary least square:

None


Probabilities that GCOS criteria is met:

Weighted least square:

None %

Ordinary least square:

None %


+057/+063 deg (BHR)


BHR statistics

Temporal stability [1/decade]:


abs

rel


Weighted least square:

None


Ordinary least square:

None


Probabilities that GCOS criteria is met:

Weighted least square:

None %

Ordinary least square:

None %


DHR statistics

Temporal stability [1/decade]:


abs

rel


Weighted least square:

None


Ordinary least square:

None


Probabilities that GCOS criteria is met:

Weighted least square:

None %

Ordinary least square:

None %


Temporal anomaly analyis

The variance of the temporal anomalies provides an additional measure about the stability of the signal AFTER removal of the mean seasonal cylce.

+000 deg


+057/+063 deg