HETAUDA


Location

lon / lat [deg]: 85.0309 / 27.4284

Source network: AERONET


Geostationary surface albedo (GSA) data


“+000”


“+057/+063”


Landcover information (based on ESA CCI landcover data)


Landcover fractions @ 2km distance


Landcover fractions @ 20 km distance


Legend


Distance to open water bodies [km]:

21.94

Distance to urban areas [km]:

0.41


Radius: 1 km

Number of landcover classes:

3

Dominant landcover type:

10: cropland, rainfed

Fraction of dominant landcover type [%]:

69.0


Radius: 2 km

Number of landcover classes:

6

Dominant landcover type:

10: cropland, rainfed

Fraction of dominant landcover type [%]:

36.0


Radius: 5 km

Number of landcover classes:

8

Dominant landcover type:

10: cropland, rainfed

Fraction of dominant landcover type [%]:

30.0


Radius: 10 km

Number of landcover classes:

8

Dominant landcover type:

10: cropland, rainfed

Fraction of dominant landcover type [%]:

21.0


Radius: 20 km

Number of landcover classes:

8

Dominant landcover type:

70: Tree cover, needleleaved, evergreen, closed to open (>15%)

Fraction of dominant landcover type [%]:

27.0


Disturbances


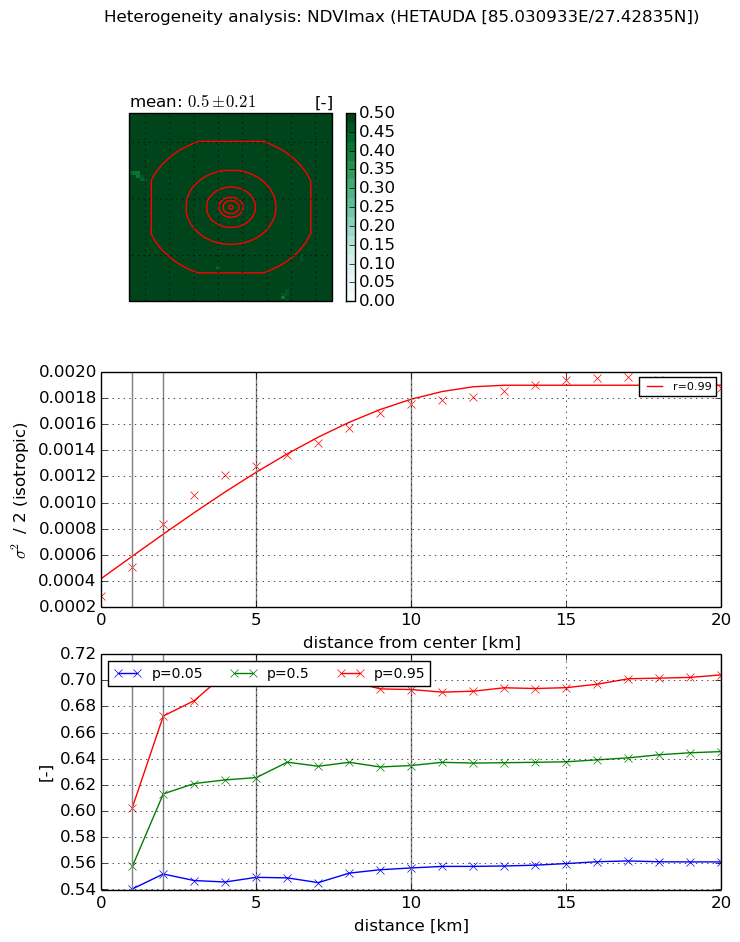
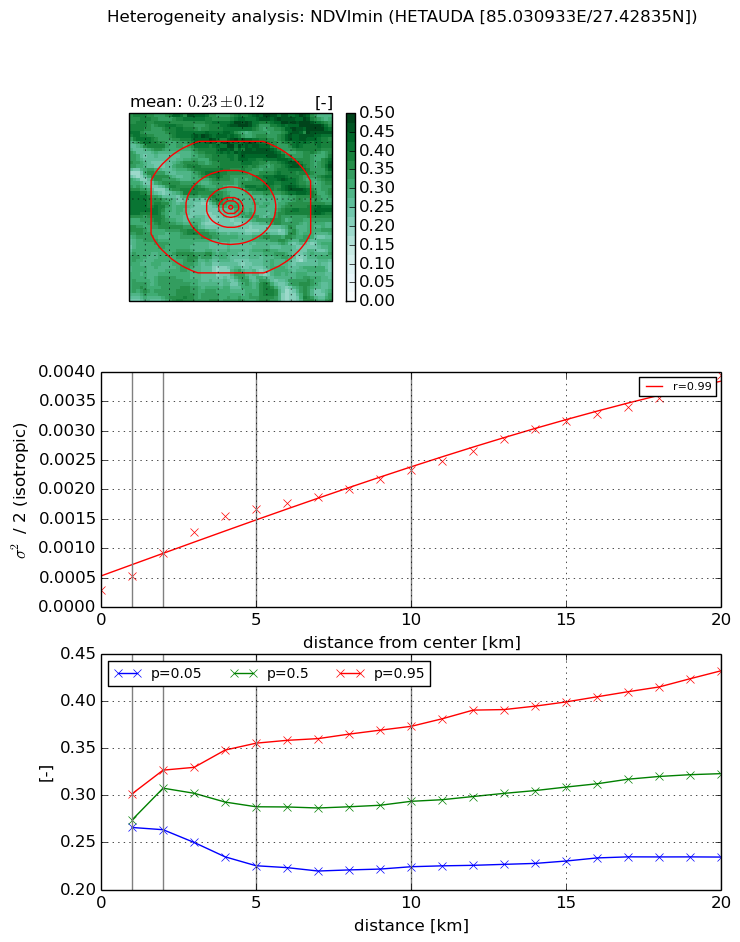
Heterogeneity analysis

The heterogeneity analysis provides information about the spatial and temporal heterogeneity of the site.

Topography


Roman et al. (2009) index


St

4.23634178251e-05

Rcv

0.018231156824

Rse

0.0

Rst

0.0381378333406

Rsv

70815.7595877


Height range @ 1km [m]

22

Height range @ 2km [m]

191

Height range @ 5km [m]

351

Height range @ 10km [m]

-999

Height range @ 20km [m]

-999


Variance slope @ 1 km

4924

Variance slope @ 2 km

5059

Variance slope @ 5 km

2882

Variance slope @ 10 km

-999

Variance slope @ 20 km

-999


NDVI (max. NDVI composite)


Roman et al. (2009) index


St

4.09665483766

Rcv

0.0560949296092

Rse

0.0

Rst

-0.143389002729

Rsv

0.53282086728


NDVI range @ 1km [-]

0.06

NDVI range @ 2km [-]

0.12

NDVI range @ 5km [-]

0.16

NDVI range @ 10km [-]

0.14

NDVI range @ 20km [-]

0.14


Variance slope @ 1 km

0.000219755457527

Variance slope @ 2 km

0.000275865867219

Variance slope @ 5 km

0.000208872818782

Variance slope @ 10 km

0.000138138366521

Variance slope @ 20 km

7.17790801323e-05


NDVI (min. NDVI composite)I


Roman et al. (2009) index


St

1.66279062103

Rcv

0.472807815108

Rse

0.0

Rst

-0.331388264642

Rsv

-0.999999807612


NDVI range @ 1km [-]

0.04

NDVI range @ 2km [-]

0.06

NDVI range @ 5km [-]

0.13

NDVI range @ 10km [-]

0.15

NDVI range @ 20km [-]

0.2


NDVI slope @ 1 km

0.000238649329945

NDVI slope @ 2 km

0.000319805225543

NDVI slope @ 5 km

0.00029426781374

NDVI slope @ 10 km

0.000195948315559

NDVI slope @ 20 km

0.000167815892357


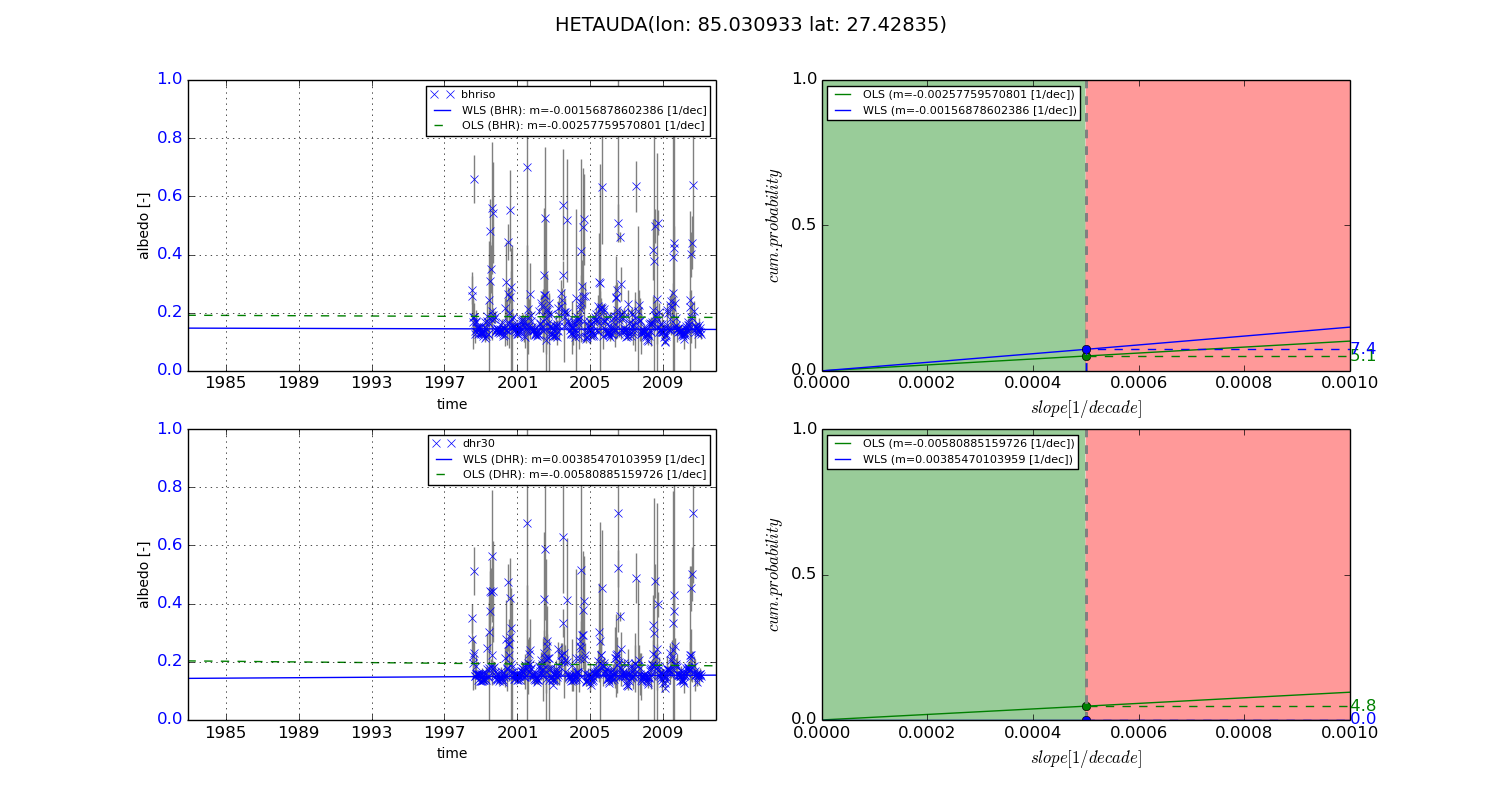
Temporal stability analysis

+000 deg (BHR)


BHR statistics

Temporal stability [1/decade]:


abs

rel


Weighted least square:

None


Ordinary least square:

None


Probabilities that GCOS criteria is met:

Weighted least square:

None %

Ordinary least square:

None %


DHR statistics

Temporal stability [1/decade]:


abs

rel


Weighted least square:

None


Ordinary least square:

None


Probabilities that GCOS criteria is met:

Weighted least square:

None %

Ordinary least square:

None %


+057/+063 deg (BHR)


BHR statistics

Temporal stability [1/decade]:


abs

rel


Weighted least square:

-0.00156878602386


Ordinary least square:

-0.00257759570801


Probabilities that GCOS criteria is met:

Weighted least square:

7.4 %

Ordinary least square:

5.1 %


DHR statistics

Temporal stability [1/decade]:


abs

rel


Weighted least square:

0.00385470103959


Ordinary least square:

-0.00580885159726


Probabilities that GCOS criteria is met:

Weighted least square:

0.0 %

Ordinary least square:

4.8 %


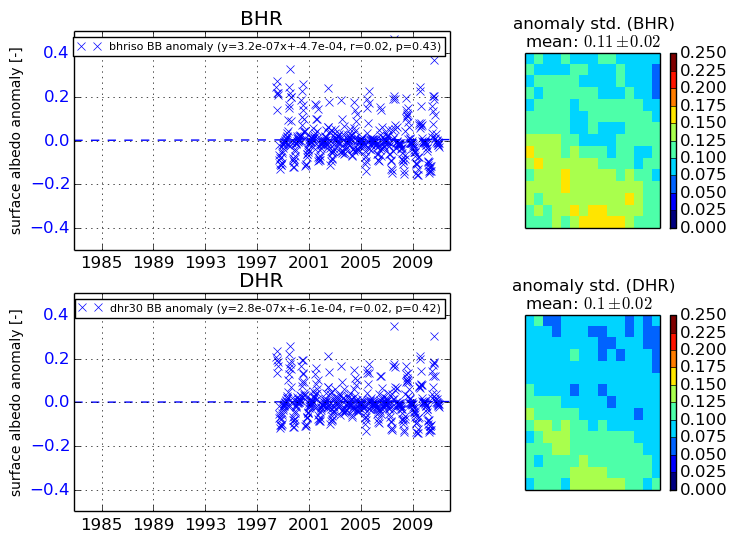
Temporal anomaly analyis

The variance of the temporal anomalies provides an additional measure about the stability of the signal AFTER removal of the mean seasonal cylce.

+000 deg


+057/+063 deg