HOHENPEISSENBERGDWD


Location

lon / lat [deg]: 11.0119 / 47.8019

Source network: AERONET


Geostationary surface albedo (GSA) data


“+000”


“+057/+063”


Landcover information (based on ESA CCI landcover data)


Landcover fractions @ 2km distance


Landcover fractions @ 20 km distance


Legend


Distance to open water bodies [km]:

6.65

Distance to urban areas [km]:

0.69


Radius: 1 km

Number of landcover classes:

6

Dominant landcover type:

130: grassland

Fraction of dominant landcover type [%]:

30.0


Radius: 2 km

Number of landcover classes:

7

Dominant landcover type:

130: grassland

Fraction of dominant landcover type [%]:

41.0


Radius: 5 km

Number of landcover classes:

8

Dominant landcover type:

70: Tree cover, needleleaved, evergreen, closed to open (>15%)

Fraction of dominant landcover type [%]:

30.0


Radius: 10 km

Number of landcover classes:

9

Dominant landcover type:

130: grassland

Fraction of dominant landcover type [%]:

43.0


Radius: 20 km

Number of landcover classes:

10

Dominant landcover type:

130: grassland

Fraction of dominant landcover type [%]:

43.0


Disturbances


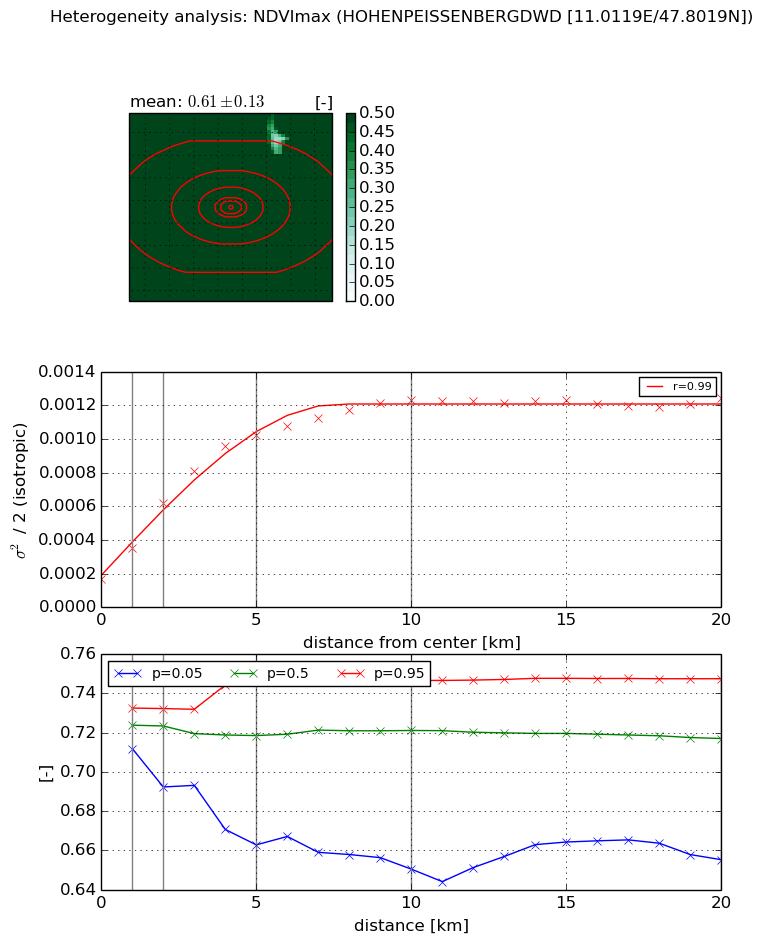
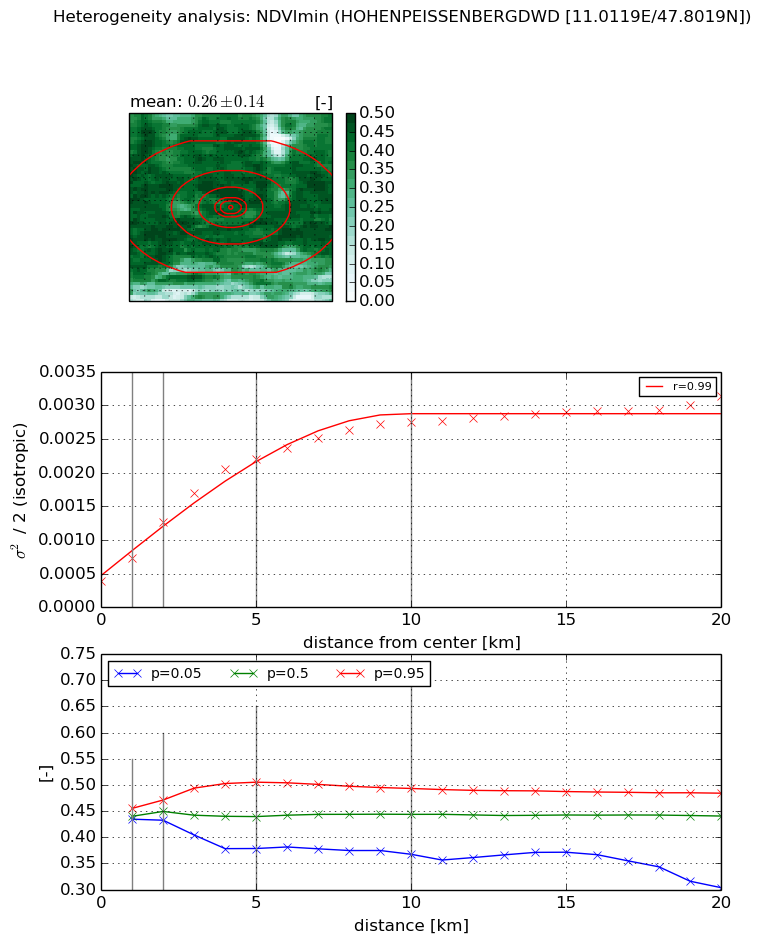
Heterogeneity analysis

The heterogeneity analysis provides information about the spatial and temporal heterogeneity of the site.

Topography


Roman et al. (2009) index


St

2.22796571775

Rcv

0.174706834323

Rse

0.0

Rst

-0.0565628256095

Rsv

1.11525016131


Height range @ 1km [m]

179

Height range @ 2km [m]

210

Height range @ 5km [m]

228

Height range @ 10km [m]

-999

Height range @ 20km [m]

-999


Variance slope @ 1 km

1398

Variance slope @ 2 km

1588

Variance slope @ 5 km

1250

Variance slope @ 10 km

-999

Variance slope @ 20 km

-999


NDVI (max. NDVI composite)


Roman et al. (2009) index


St

2.02886402592

Rcv

1.00242391347

Rse

0.0

Rst

-0.101099732091

Rsv

0.375136314733


NDVI range @ 1km [-]

0.02

NDVI range @ 2km [-]

0.04

NDVI range @ 5km [-]

0.08

NDVI range @ 10km [-]

0.1

NDVI range @ 20km [-]

0.09


Variance slope @ 1 km

0.000180651418894

Variance slope @ 2 km

0.000223923239468

Variance slope @ 5 km

0.0001793942058

Variance slope @ 10 km

0.000101699811518

Variance slope @ 20 km

3.81059200513e-05


NDVI (min. NDVI composite)I


Roman et al. (2009) index


St

0.830265369349

Rcv

0.450915456014

Rse

0.0

Rst

0.0200949456611

Rsv

3.14229217694


NDVI range @ 1km [-]

0.02

NDVI range @ 2km [-]

0.04

NDVI range @ 5km [-]

0.13

NDVI range @ 10km [-]

0.13

NDVI range @ 20km [-]

0.18


NDVI slope @ 1 km

0.000349335419556

NDVI slope @ 2 km

0.000441066576573

NDVI slope @ 5 km

0.000385268773245

NDVI slope @ 10 km

0.00023496524105

NDVI slope @ 20 km

0.000106596766745


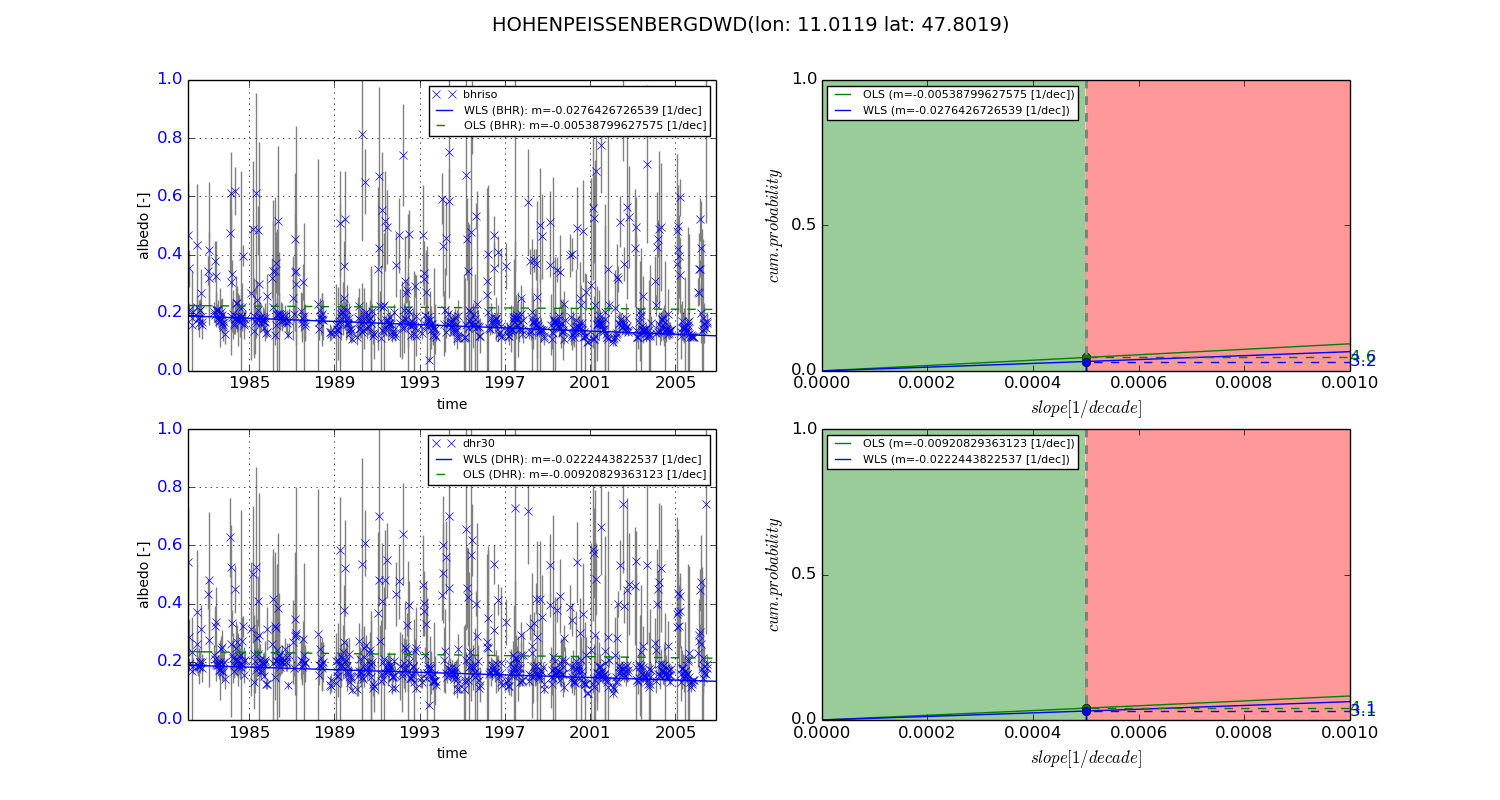
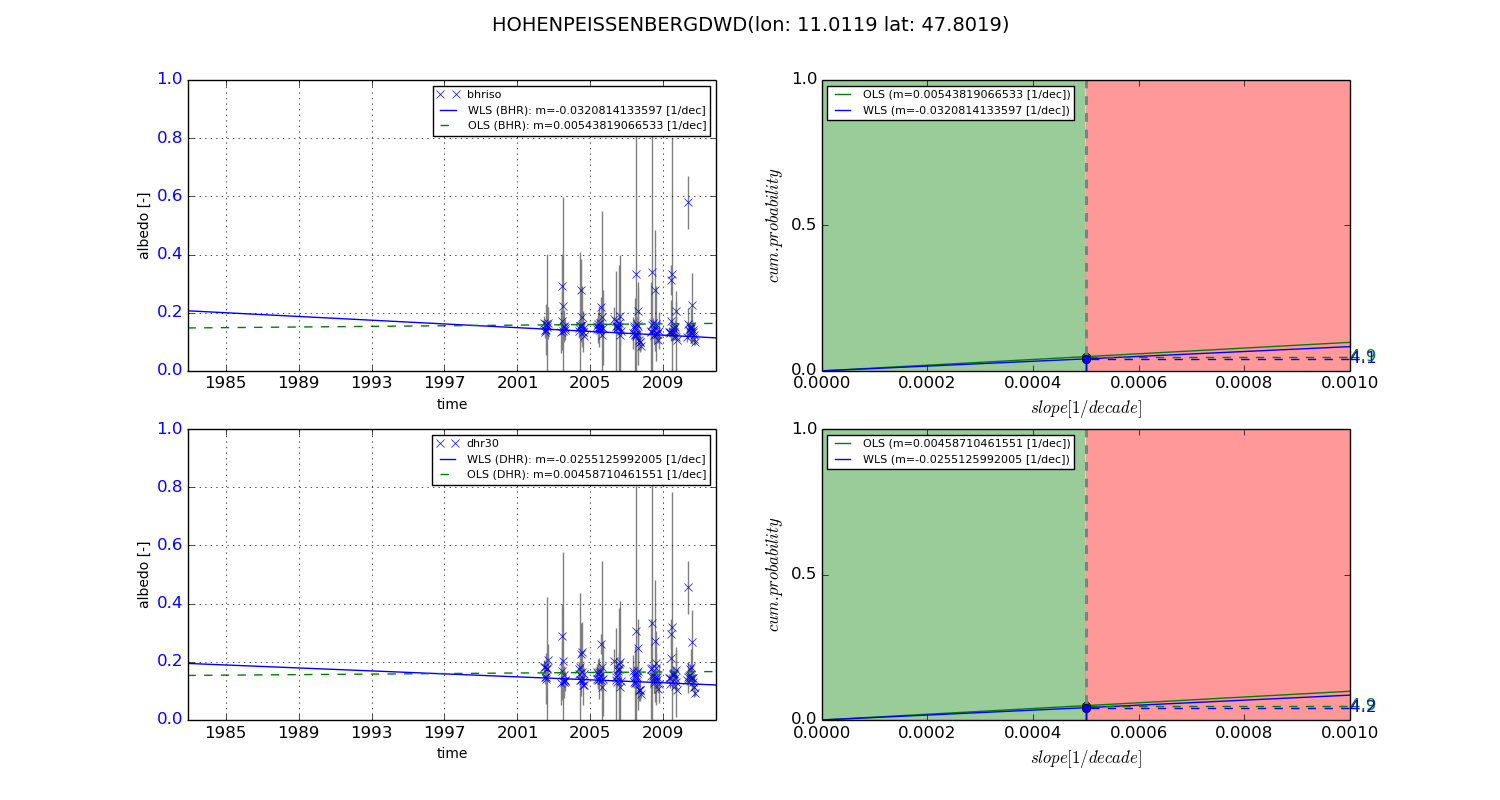
Temporal stability analysis

+000 deg (BHR)


BHR statistics

Temporal stability [1/decade]:


abs

rel


Weighted least square:

-0.0276426726539


Ordinary least square:

-0.00538799627575


Probabilities that GCOS criteria is met:

Weighted least square:

3.2 %

Ordinary least square:

4.6 %


DHR statistics

Temporal stability [1/decade]:


abs

rel


Weighted least square:

-0.0222443822537


Ordinary least square:

-0.00920829363123


Probabilities that GCOS criteria is met:

Weighted least square:

3.1 %

Ordinary least square:

4.1 %


+057/+063 deg (BHR)


BHR statistics

Temporal stability [1/decade]:


abs

rel


Weighted least square:

-0.0320814133597


Ordinary least square:

0.00543819066533


Probabilities that GCOS criteria is met:

Weighted least square:

4.1 %

Ordinary least square:

4.9 %


DHR statistics

Temporal stability [1/decade]:


abs

rel


Weighted least square:

-0.0255125992005


Ordinary least square:

0.00458710461551


Probabilities that GCOS criteria is met:

Weighted least square:

4.2 %

Ordinary least square:

4.9 %


Temporal anomaly analyis

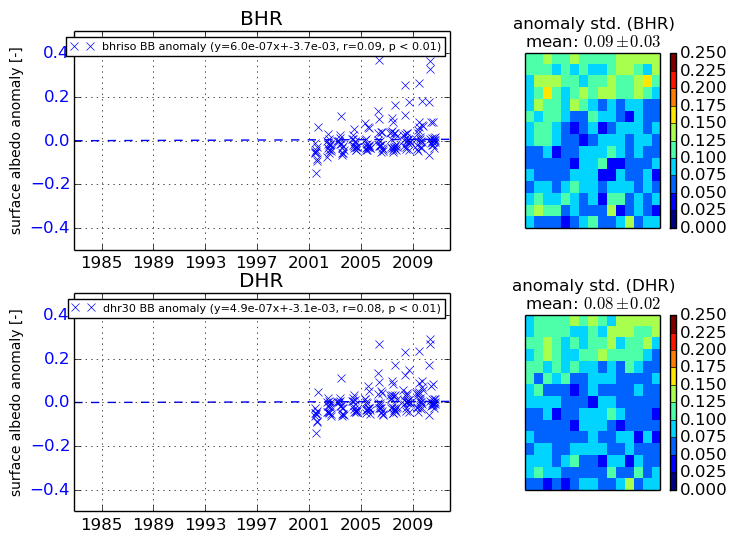
The variance of the temporal anomalies provides an additional measure about the stability of the signal AFTER removal of the mean seasonal cylce.
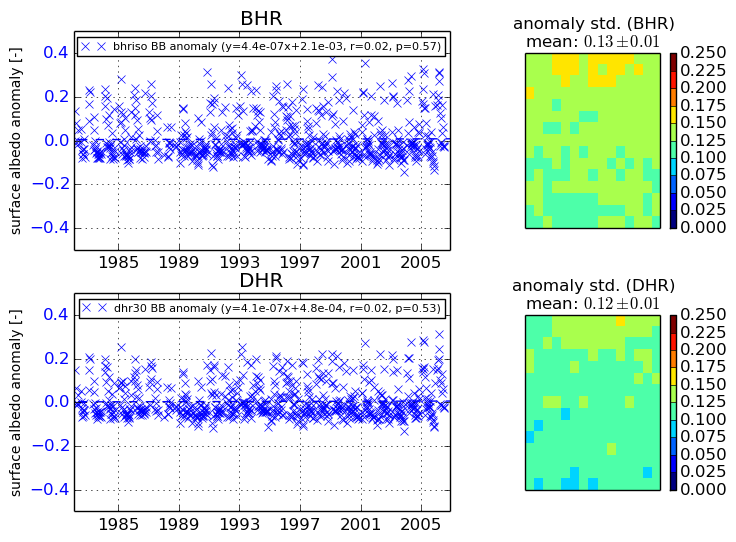
+000 deg


+057/+063 deg