HOMBURI


Location

lon / lat [deg]: -1.5467 / 15.3292

Source network: AERONET


Geostationary surface albedo (GSA) data


“+000”


“+057/+063”


Landcover information (based on ESA CCI landcover data)


Landcover fractions @ 2km distance


Landcover fractions @ 20 km distance


Legend


Distance to open water bodies [km]:

9.51

Distance to urban areas [km]:

none in region


Radius: 1 km

Number of landcover classes:

2

Dominant landcover type:

130: grassland

Fraction of dominant landcover type [%]:

85.0


Radius: 2 km

Number of landcover classes:

2

Dominant landcover type:

130: grassland

Fraction of dominant landcover type [%]:

93.0


Radius: 5 km

Number of landcover classes:

4

Dominant landcover type:

130: grassland

Fraction of dominant landcover type [%]:

88.0


Radius: 10 km

Number of landcover classes:

4

Dominant landcover type:

130: grassland

Fraction of dominant landcover type [%]:

83.0


Radius: 20 km

Number of landcover classes:

4

Dominant landcover type:

130: grassland

Fraction of dominant landcover type [%]:

71.0


Disturbances


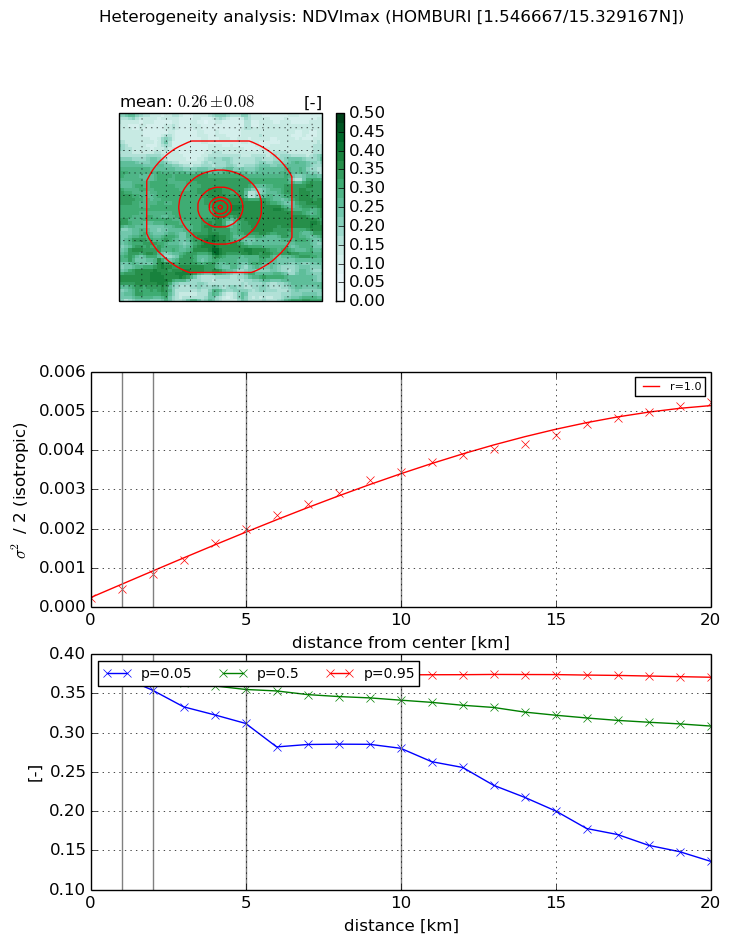
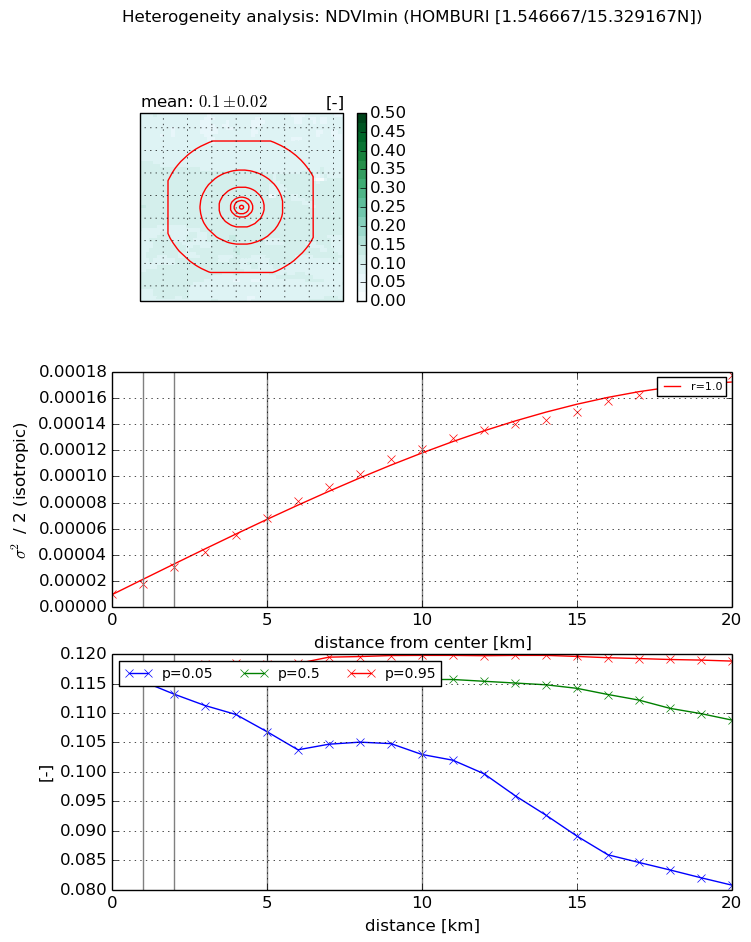
Heterogeneity analysis

The heterogeneity analysis provides information about the spatial and temporal heterogeneity of the site.

Topography


Roman et al. (2009) index


St

2.10051889886

Rcv

0.449037791659

Rse

0.0

Rst

-1.60153962343e-05

Rsv

-0.979164716295


Height range @ 1km [m]

12

Height range @ 2km [m]

25

Height range @ 5km [m]

51

Height range @ 10km [m]

-999

Height range @ 20km [m]

-999


Variance slope @ 1 km

48

Variance slope @ 2 km

49

Variance slope @ 5 km

53

Variance slope @ 10 km

-999

Variance slope @ 20 km

-999


NDVI (max. NDVI composite)


Roman et al. (2009) index


St

1.32725018129

Rcv

1.15797376255

Rse

0.0

Rst

-0.102339006636

Rsv

-0.999999598666


NDVI range @ 1km [-]

0.0

NDVI range @ 2km [-]

0.02

NDVI range @ 5km [-]

0.06

NDVI range @ 10km [-]

0.09

NDVI range @ 20km [-]

0.23


Variance slope @ 1 km

0.00021844964427

Variance slope @ 2 km

0.000308290365796

Variance slope @ 5 km

0.000363831703779

Variance slope @ 10 km

0.00033605430492

Variance slope @ 20 km

0.000252825764541


NDVI (min. NDVI composite)I


Roman et al. (2009) index


St

1.7382663091

Rcv

0.637594313959

Rse

0.0

Rst

-0.0882634612268

Rsv

-0.999999755556


NDVI range @ 1km [-]

0.0

NDVI range @ 2km [-]

0.0

NDVI range @ 5km [-]

0.01

NDVI range @ 10km [-]

0.02

NDVI range @ 20km [-]

0.04


NDVI slope @ 1 km

7.78459708218e-06

NDVI slope @ 2 km

1.04136451019e-05

NDVI slope @ 5 km

1.19035616305e-05

NDVI slope @ 10 km

1.15860196043e-05

NDVI slope @ 20 km

8.44328947652e-06


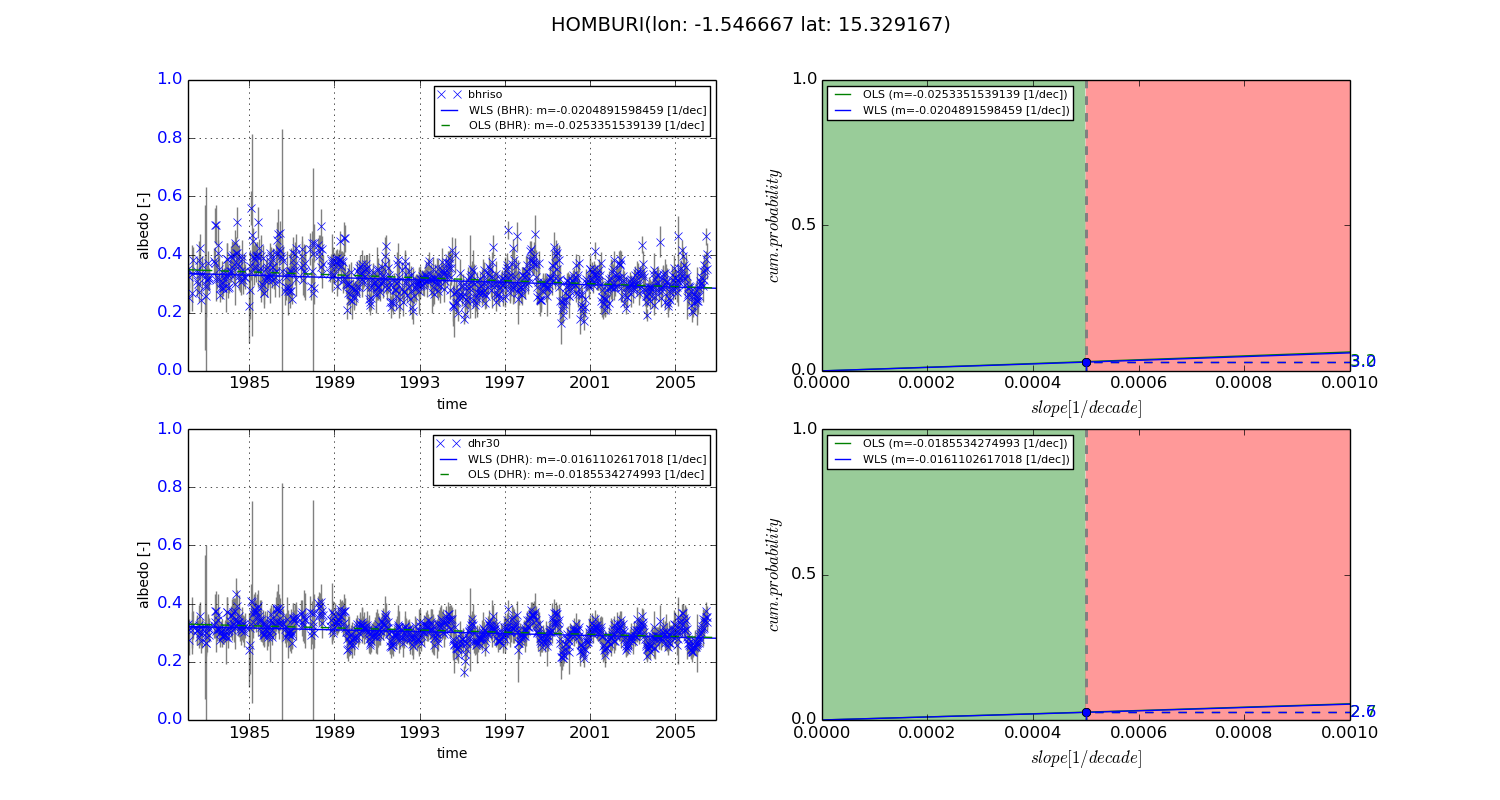
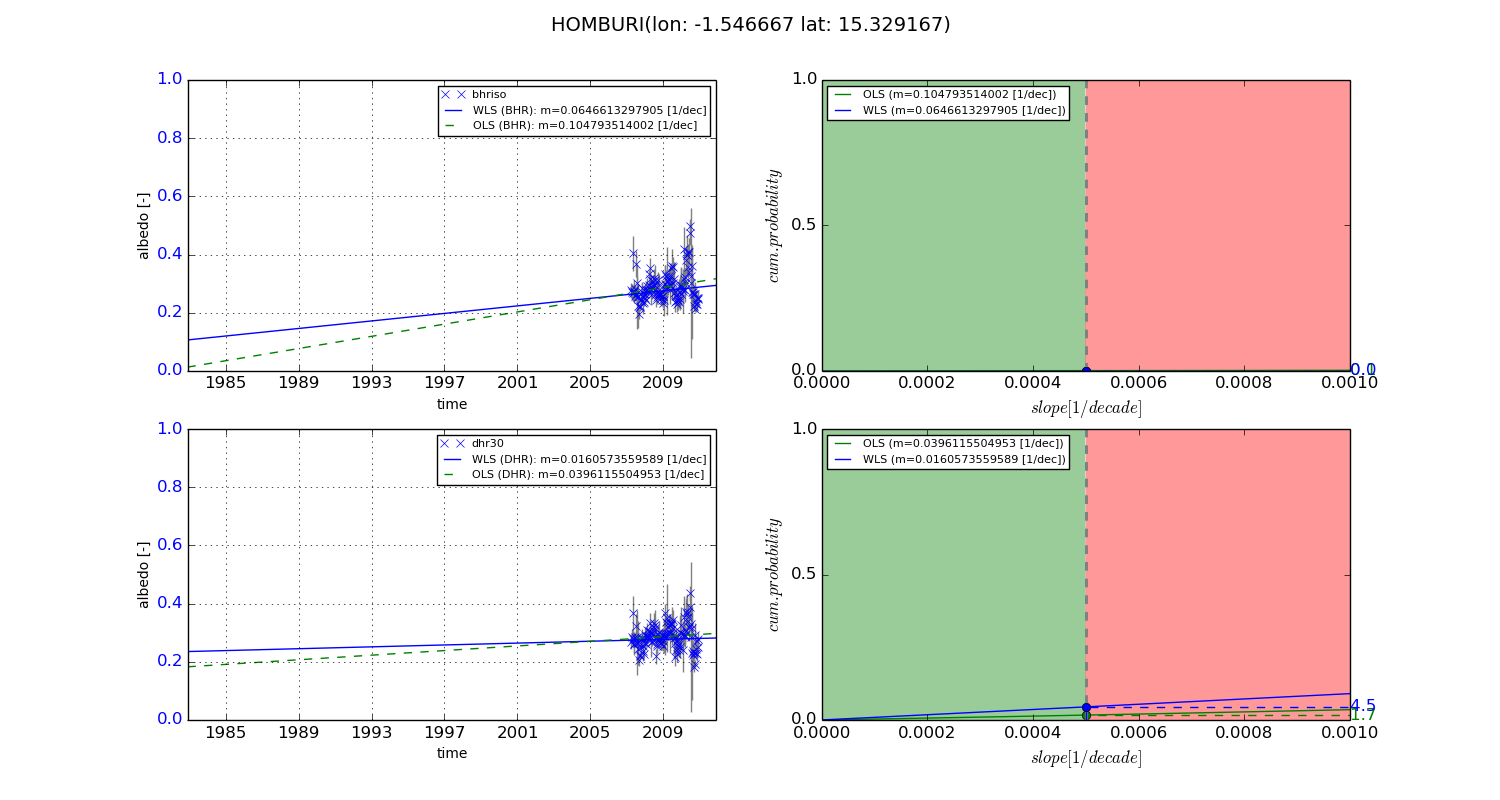
Temporal stability analysis

+000 deg (BHR)


BHR statistics

Temporal stability [1/decade]:


abs

rel


Weighted least square:

-0.0204891598459


Ordinary least square:

-0.0253351539139


Probabilities that GCOS criteria is met:

Weighted least square:

3.0 %

Ordinary least square:

3.2 %


DHR statistics

Temporal stability [1/decade]:


abs

rel


Weighted least square:

-0.0161102617018


Ordinary least square:

-0.0185534274993


Probabilities that GCOS criteria is met:

Weighted least square:

2.6 %

Ordinary least square:

2.7 %


+057/+063 deg (BHR)


BHR statistics

Temporal stability [1/decade]:


abs

rel


Weighted least square:

0.0646613297905


Ordinary least square:

0.104793514002


Probabilities that GCOS criteria is met:

Weighted least square:

0.0 %

Ordinary least square:

0.1 %


DHR statistics

Temporal stability [1/decade]:


abs

rel


Weighted least square:

0.0160573559589


Ordinary least square:

0.0396115504953


Probabilities that GCOS criteria is met:

Weighted least square:

4.5 %

Ordinary least square:

1.7 %


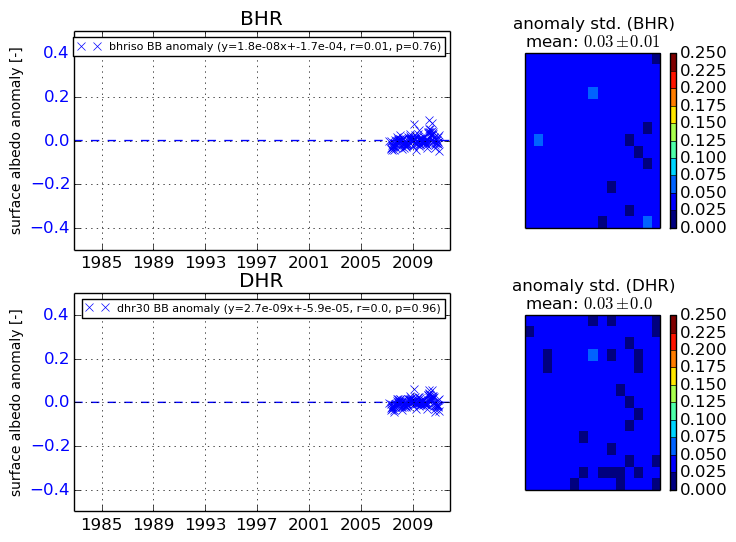
Temporal anomaly analyis

The variance of the temporal anomalies provides an additional measure about the stability of the signal AFTER removal of the mean seasonal cylce.
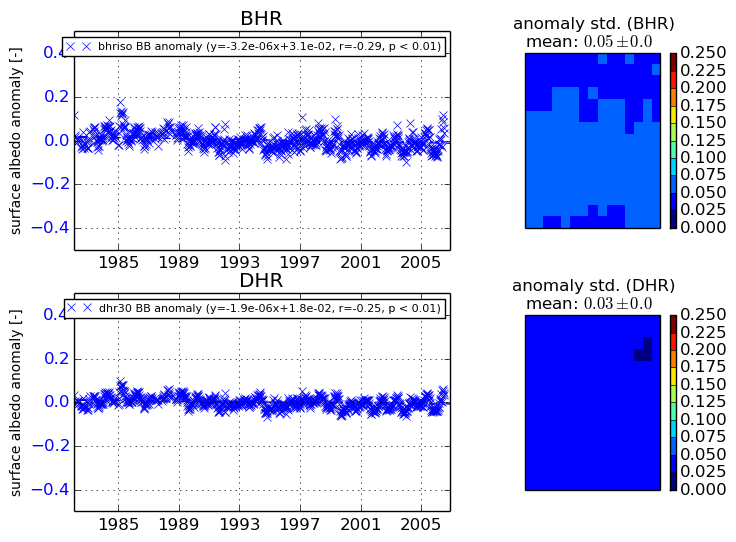
+000 deg


+057/+063 deg