HOPE-INSELHOMBROICH


Location

lon / lat [deg]: 6.6436 / 51.1514

Source network: AERONET


Geostationary surface albedo (GSA) data


“+000”


“+057/+063”


Landcover information (based on ESA CCI landcover data)


Landcover fractions @ 2km distance


Landcover fractions @ 20 km distance


Legend


Distance to open water bodies [km]:

7.21

Distance to urban areas [km]:

1.46


Radius: 1 km

Number of landcover classes:

2

Dominant landcover type:

10: cropland, rainfed

Fraction of dominant landcover type [%]:

98.0


Radius: 2 km

Number of landcover classes:

3

Dominant landcover type:

10: cropland, rainfed

Fraction of dominant landcover type [%]:

80.0


Radius: 5 km

Number of landcover classes:

3

Dominant landcover type:

10: cropland, rainfed

Fraction of dominant landcover type [%]:

51.0


Radius: 10 km

Number of landcover classes:

4

Dominant landcover type:

190: urban areas

Fraction of dominant landcover type [%]:

56.0


Radius: 20 km

Number of landcover classes:

4

Dominant landcover type:

190: urban areas

Fraction of dominant landcover type [%]:

59.0


Disturbances


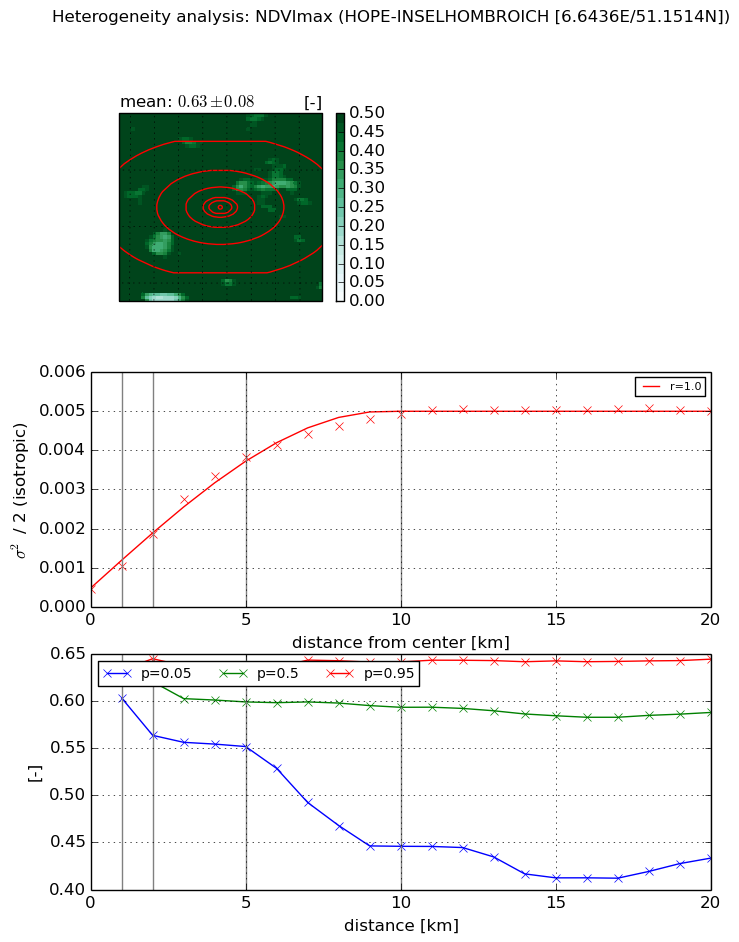
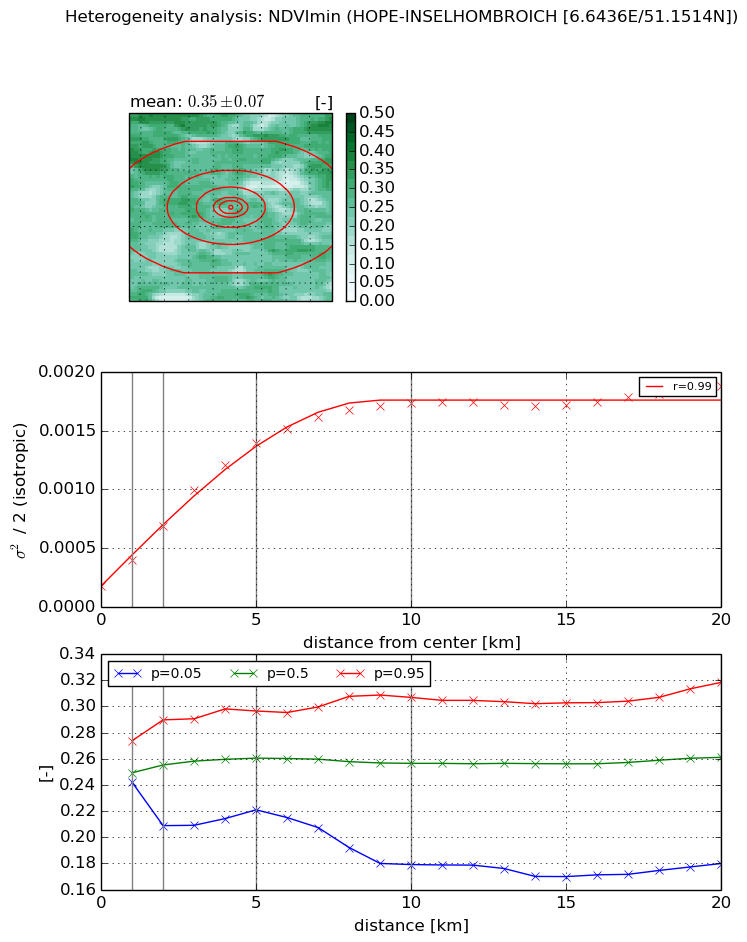
Heterogeneity analysis

The heterogeneity analysis provides information about the spatial and temporal heterogeneity of the site.

Topography


Roman et al. (2009) index


St

30.146768581

Rcv

0.0691913421683

Rse

0.0

Rst

0.00455104251837

Rsv

0.0257707685037


Height range @ 1km [m]

14

Height range @ 2km [m]

23

Height range @ 5km [m]

26

Height range @ 10km [m]

-999

Height range @ 20km [m]

-999


Variance slope @ 1 km

15

Variance slope @ 2 km

16

Variance slope @ 5 km

15

Variance slope @ 10 km

-999

Variance slope @ 20 km

-999


NDVI (max. NDVI composite)


Roman et al. (2009) index


St

1.79777107426

Rcv

-0.00917776579878

Rse

0.0

Rst

-0.510481454648

Rsv

1.14907382513


NDVI range @ 1km [-]

0.03

NDVI range @ 2km [-]

0.08

NDVI range @ 5km [-]

0.08

NDVI range @ 10km [-]

0.2

NDVI range @ 20km [-]

0.21


Variance slope @ 1 km

0.000602879175934

Variance slope @ 2 km

0.000705140606437

Variance slope @ 5 km

0.000706061651774

Variance slope @ 10 km

0.000452862476892

Variance slope @ 20 km

0.000188992090852


NDVI (min. NDVI composite)I


Roman et al. (2009) index


St

14.1740759473

Rcv

-0.102383012416

Rse

0.0

Rst

0.0180674075542

Rsv

-0.0912035891626


NDVI range @ 1km [-]

0.03

NDVI range @ 2km [-]

0.08

NDVI range @ 5km [-]

0.08

NDVI range @ 10km [-]

0.13

NDVI range @ 20km [-]

0.14


NDVI slope @ 1 km

0.000220688132819

NDVI slope @ 2 km

0.000253188735167

NDVI slope @ 5 km

0.000250197938897

NDVI slope @ 10 km

0.000159223936645

NDVI slope @ 20 km

6.59419986572e-05


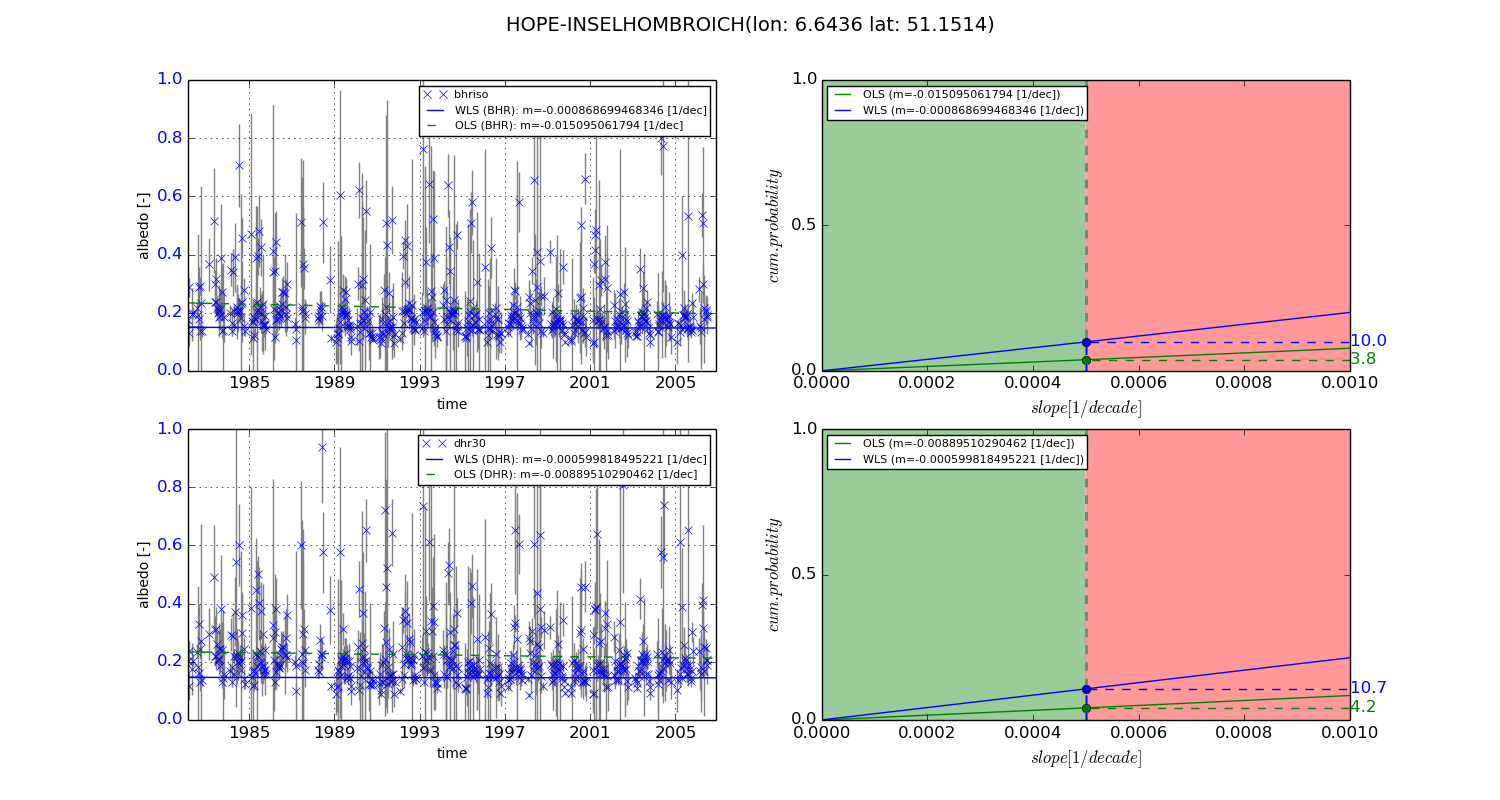
Temporal stability analysis

+000 deg (BHR)


BHR statistics

Temporal stability [1/decade]:


abs

rel


Weighted least square:

-0.000868699468346


Ordinary least square:

-0.015095061794


Probabilities that GCOS criteria is met:

Weighted least square:

10.0 %

Ordinary least square:

3.8 %


DHR statistics

Temporal stability [1/decade]:


abs

rel


Weighted least square:

-0.000599818495221


Ordinary least square:

-0.00889510290462


Probabilities that GCOS criteria is met:

Weighted least square:

10.7 %

Ordinary least square:

4.2 %


+057/+063 deg (BHR)


BHR statistics

Temporal stability [1/decade]:


abs

rel


Weighted least square:

-99999.0


Ordinary least square:

-99999.0


Probabilities that GCOS criteria is met:

Weighted least square:

-99999.0 %

Ordinary least square:

-99999.0 %


DHR statistics

Temporal stability [1/decade]:


abs

rel


Weighted least square:

-99999.0


Ordinary least square:

-99999.0


Probabilities that GCOS criteria is met:

Weighted least square:

-99999.0 %

Ordinary least square:

-99999.0 %


Temporal anomaly analyis

The variance of the temporal anomalies provides an additional measure about the stability of the signal AFTER removal of the mean seasonal cylce.
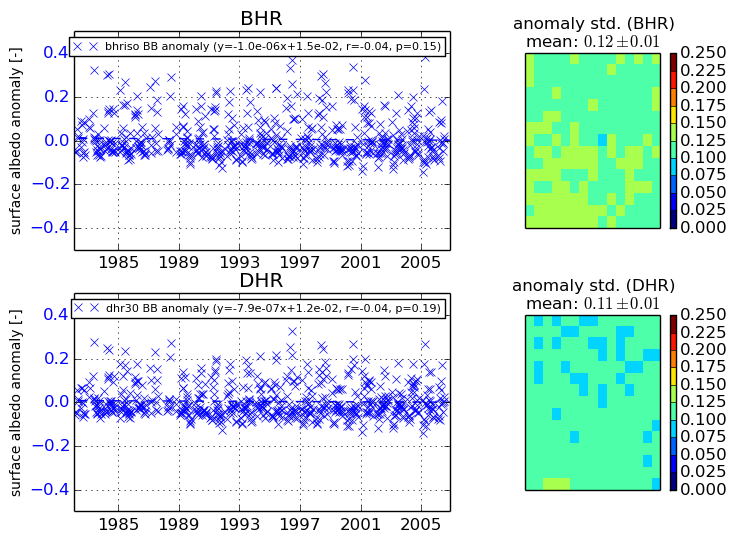
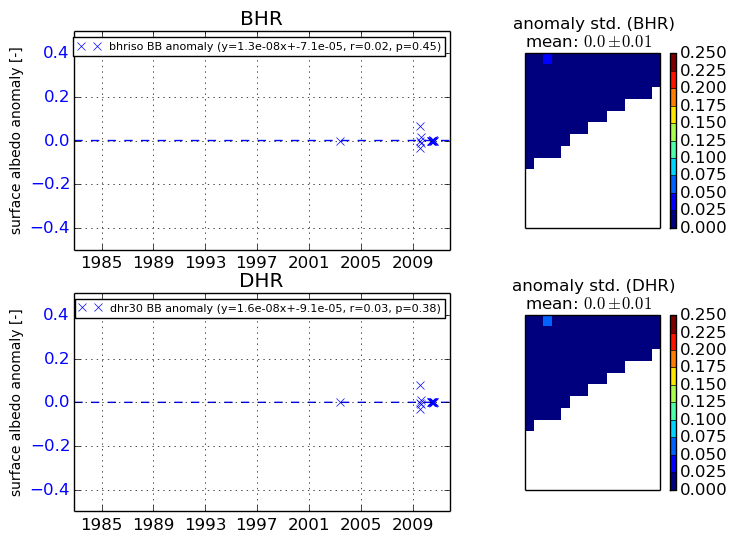
+000 deg


+057/+063 deg