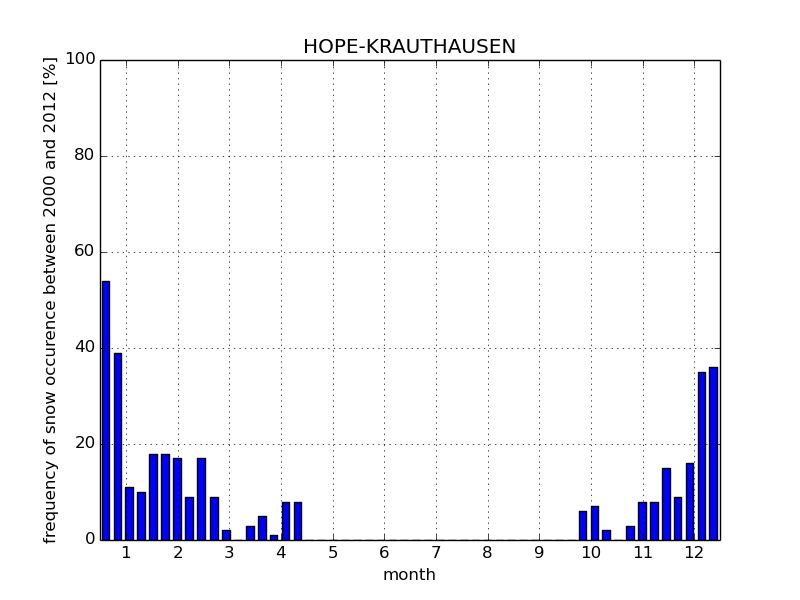
HOPE-KRAUTHAUSEN
|
|
|

|
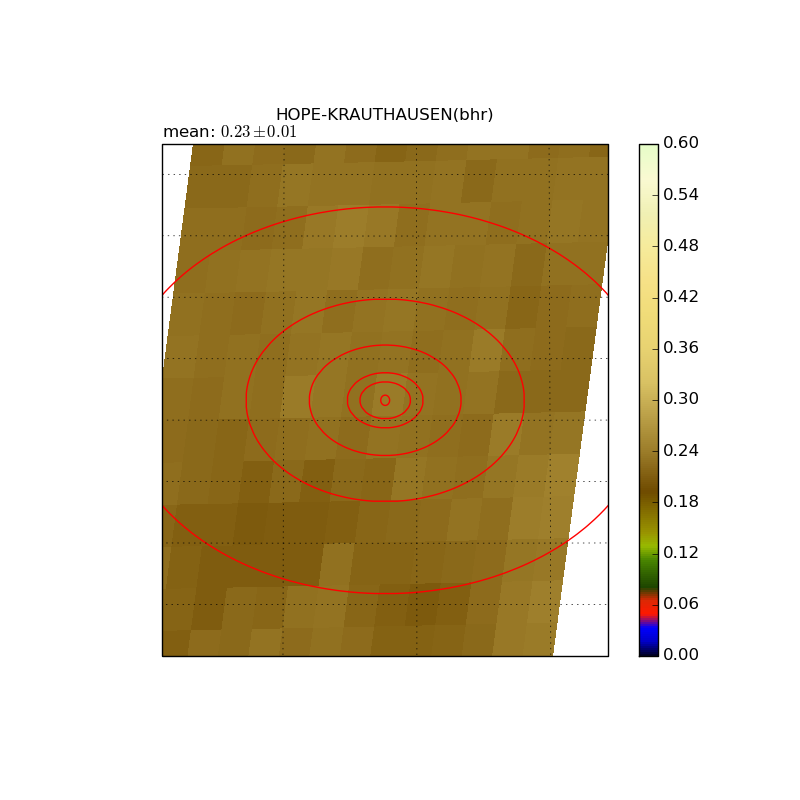
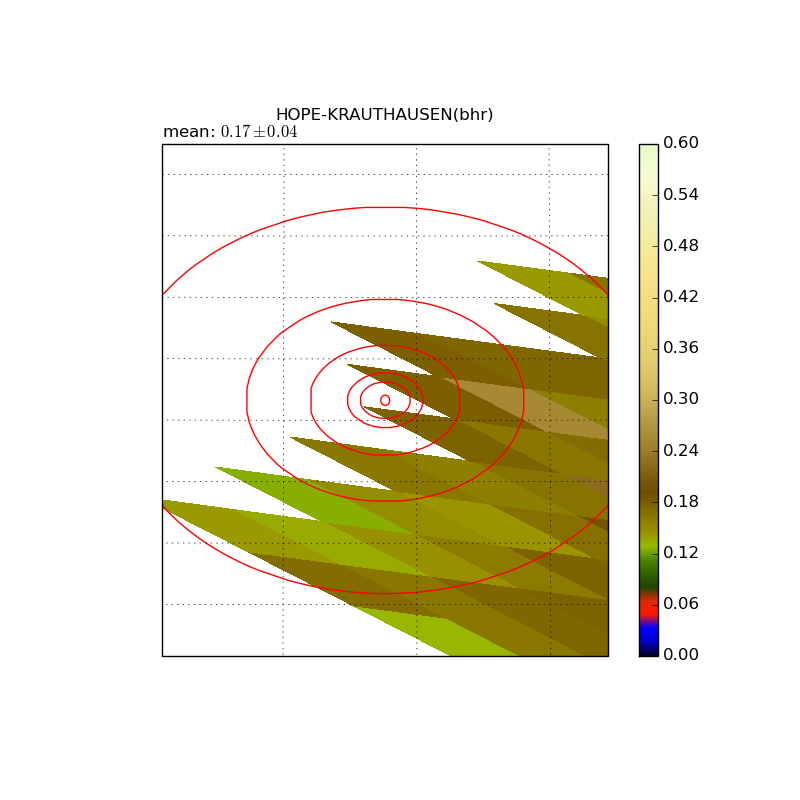
HOPE-KRAUTHAUSEN
|
|
|
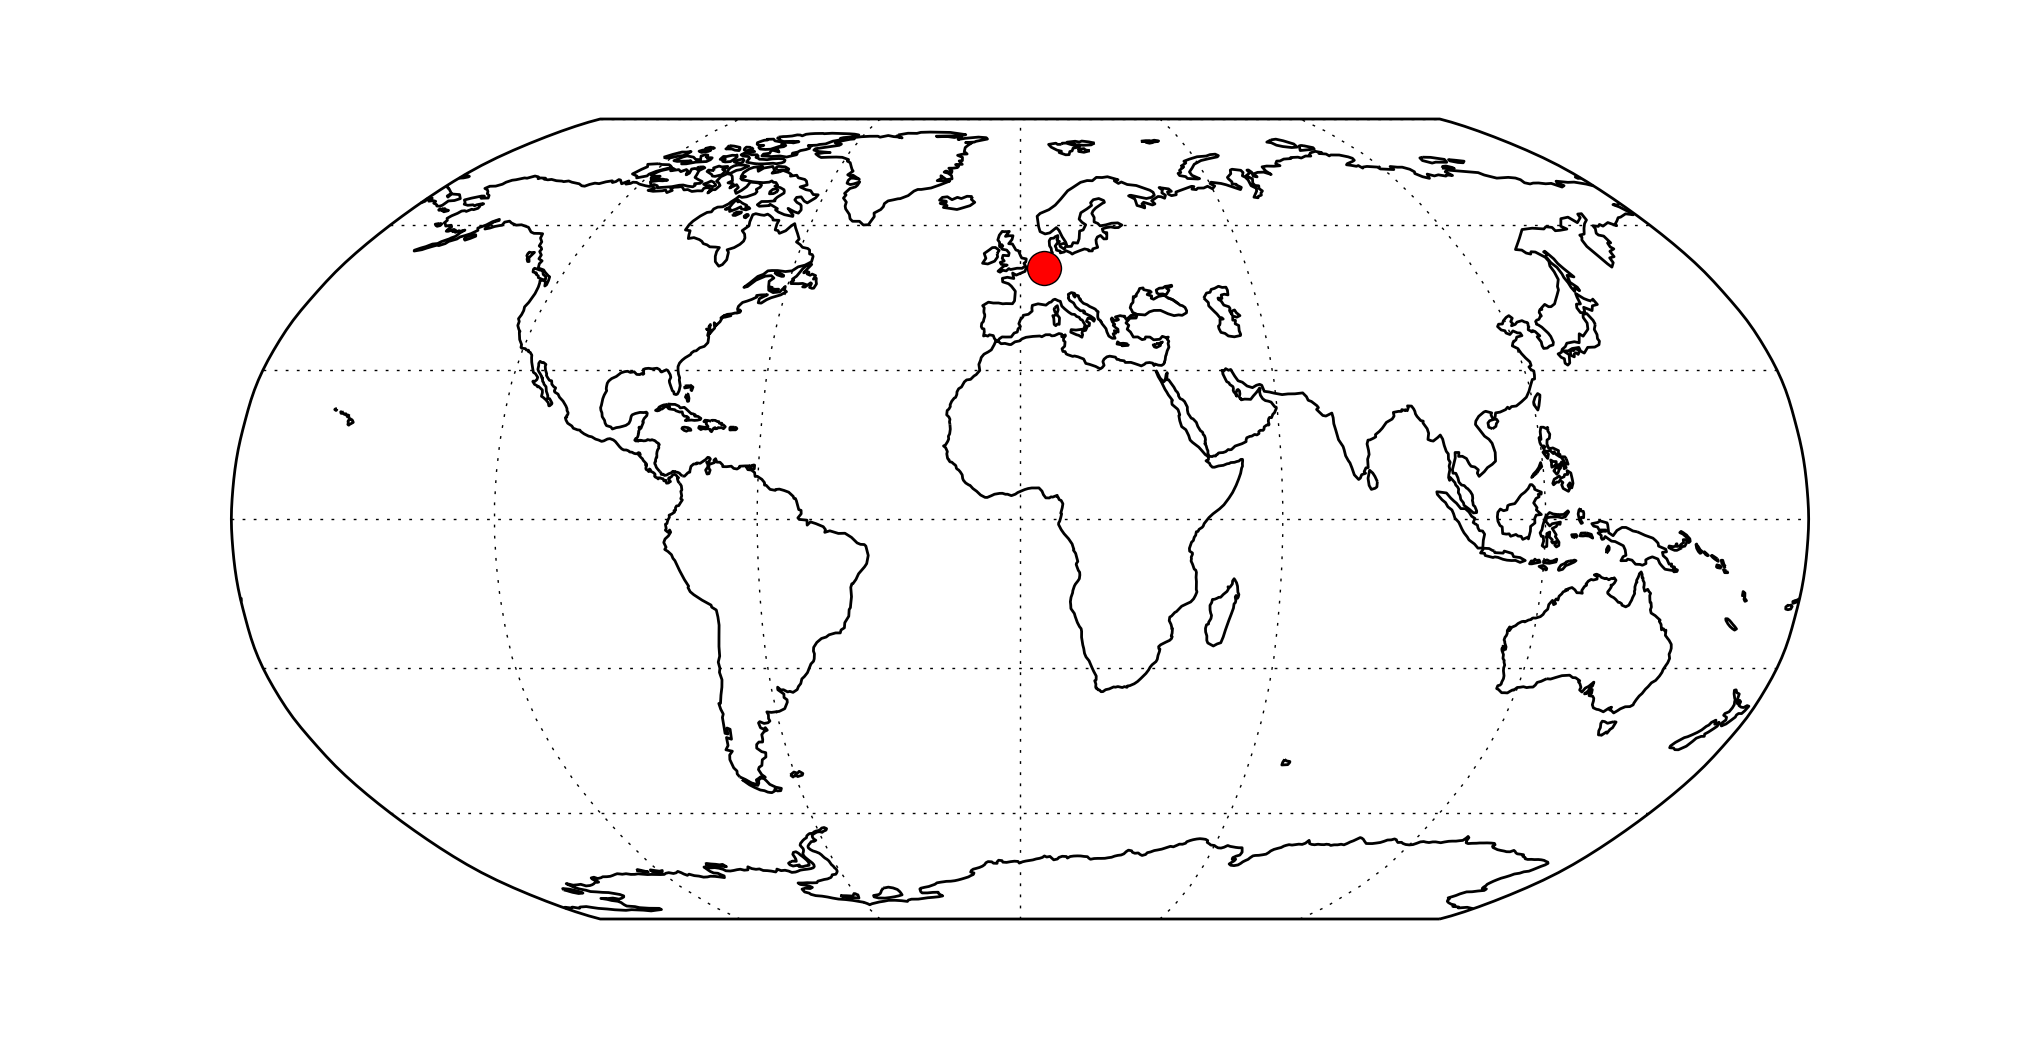
lon / lat [deg]: 6.4145 / 50.8796 Source network: AERONET |
|
|
|
|
|
|
|
|
|
|
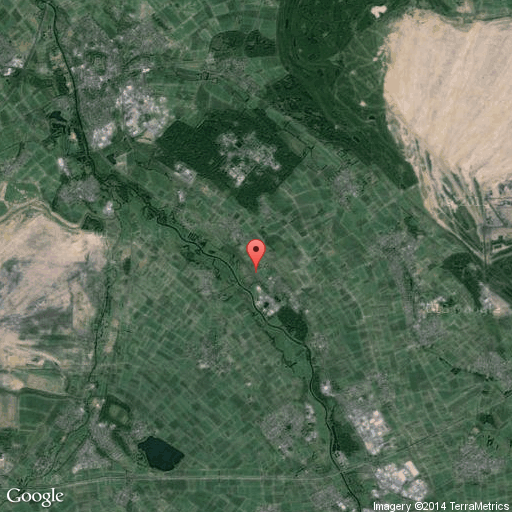
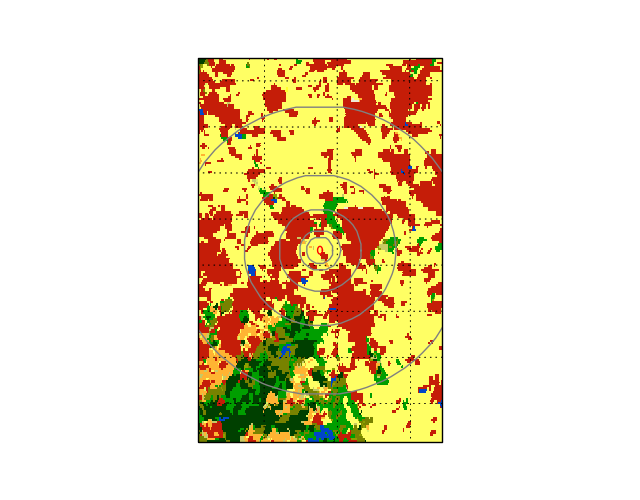
Distance to open water bodies [km]: |
4.68 |
|
Distance to urban areas [km]: |
0.44 |
|
Radius: 1 km
|
|
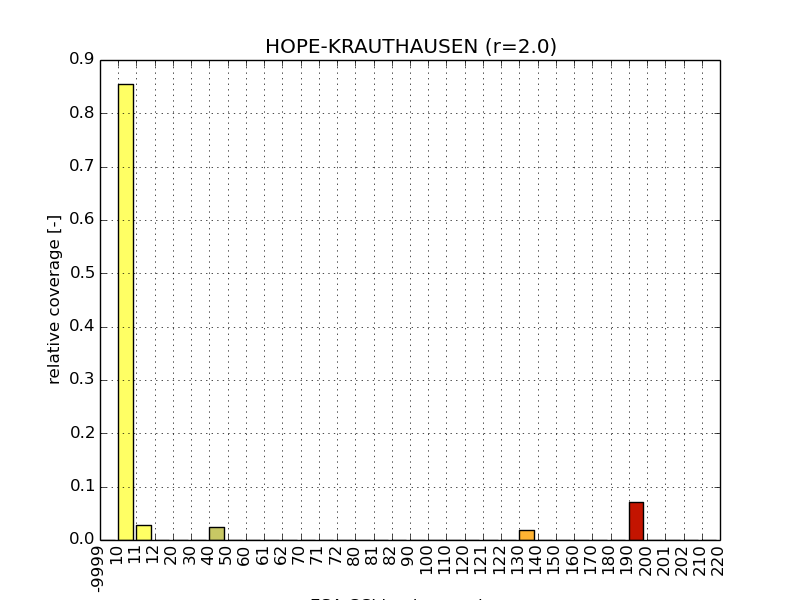
Radius: 2 km
|
|
Radius: 5 km
|
|
Radius: 10 km
|
|
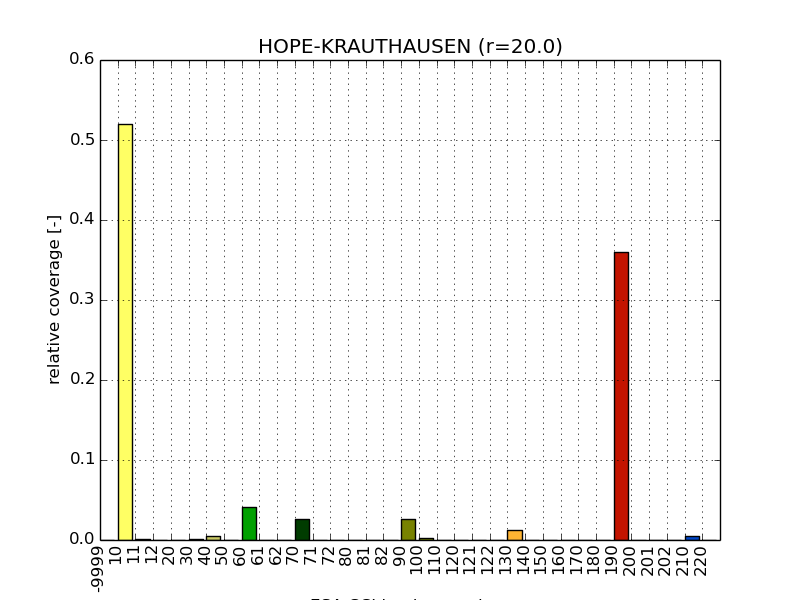
Radius: 20 km
|
|
|
|
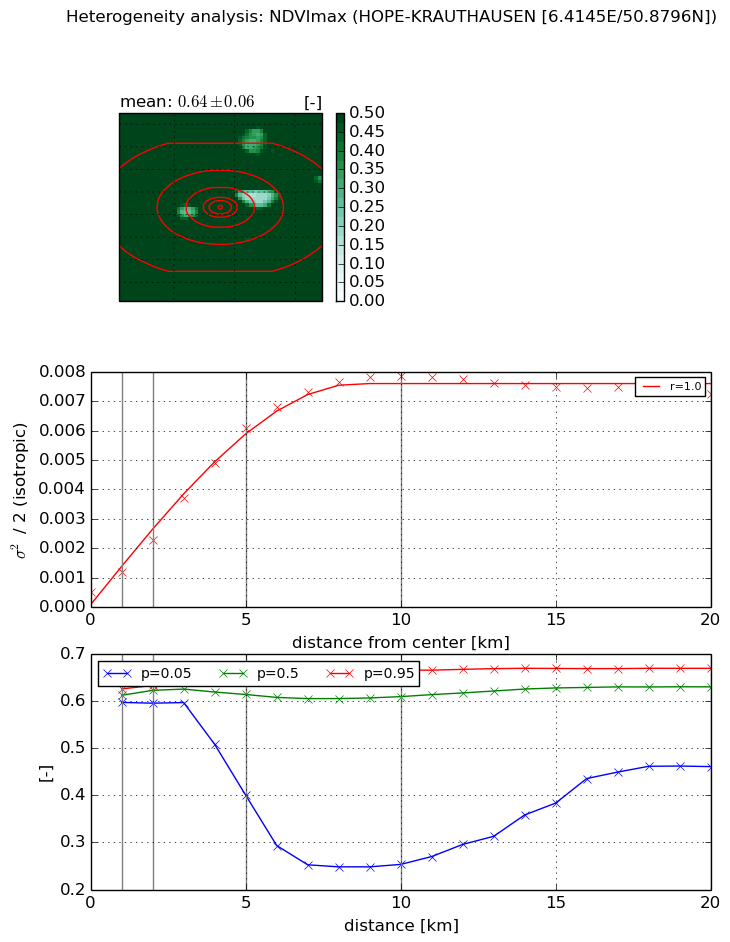
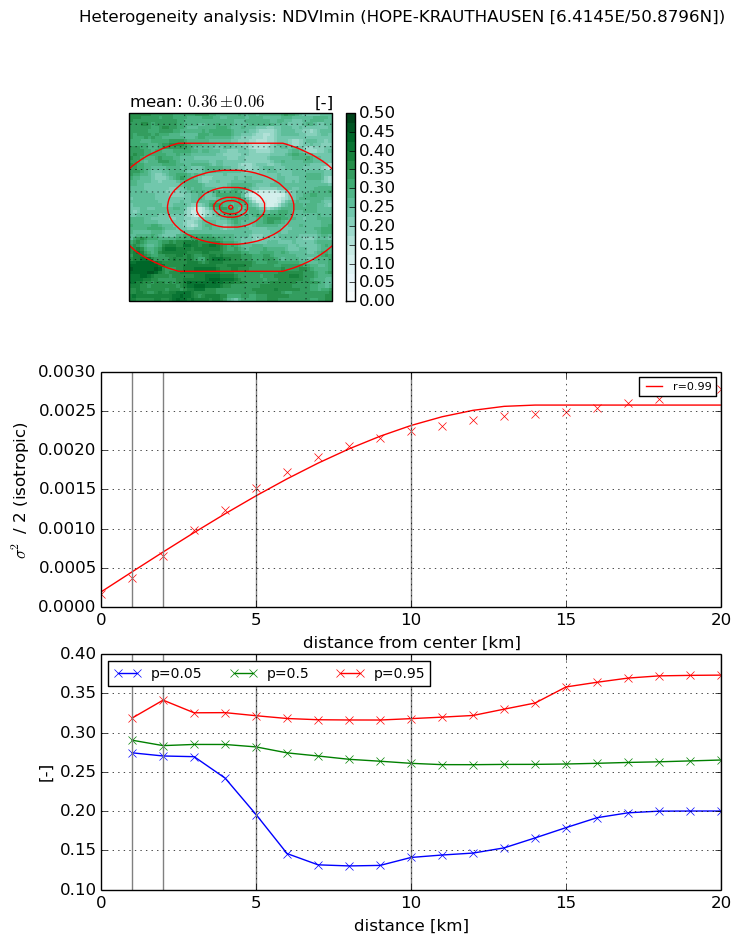
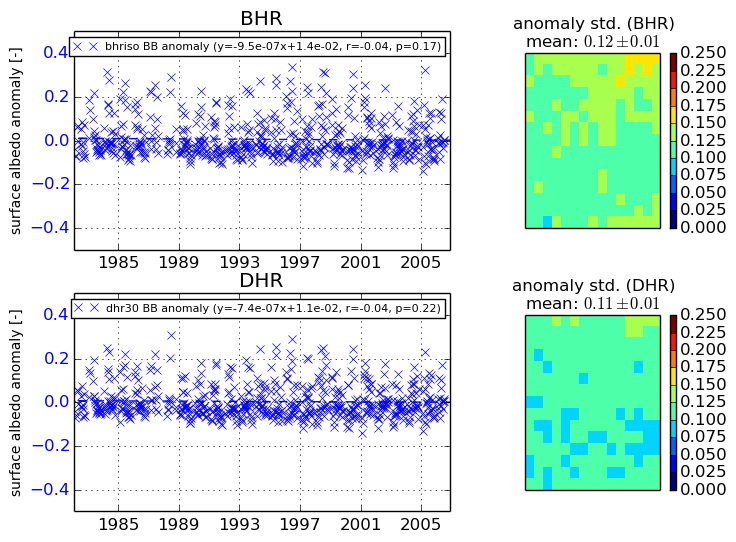
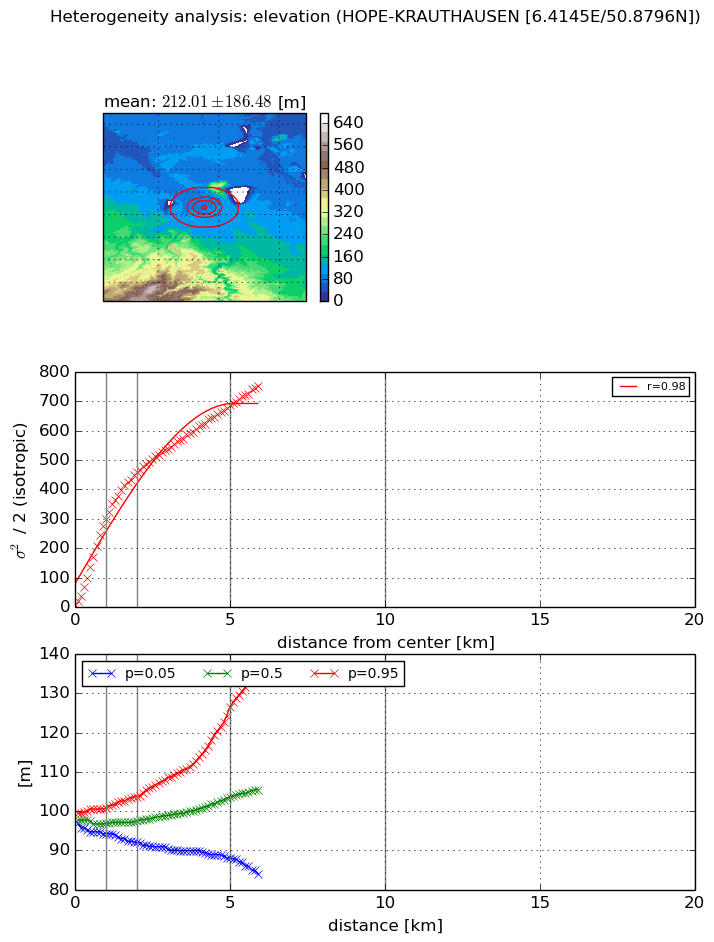
The heterogeneity analysis provides information about the spatial and temporal heterogeneity of the site.
|
|
|
|
|
|
|
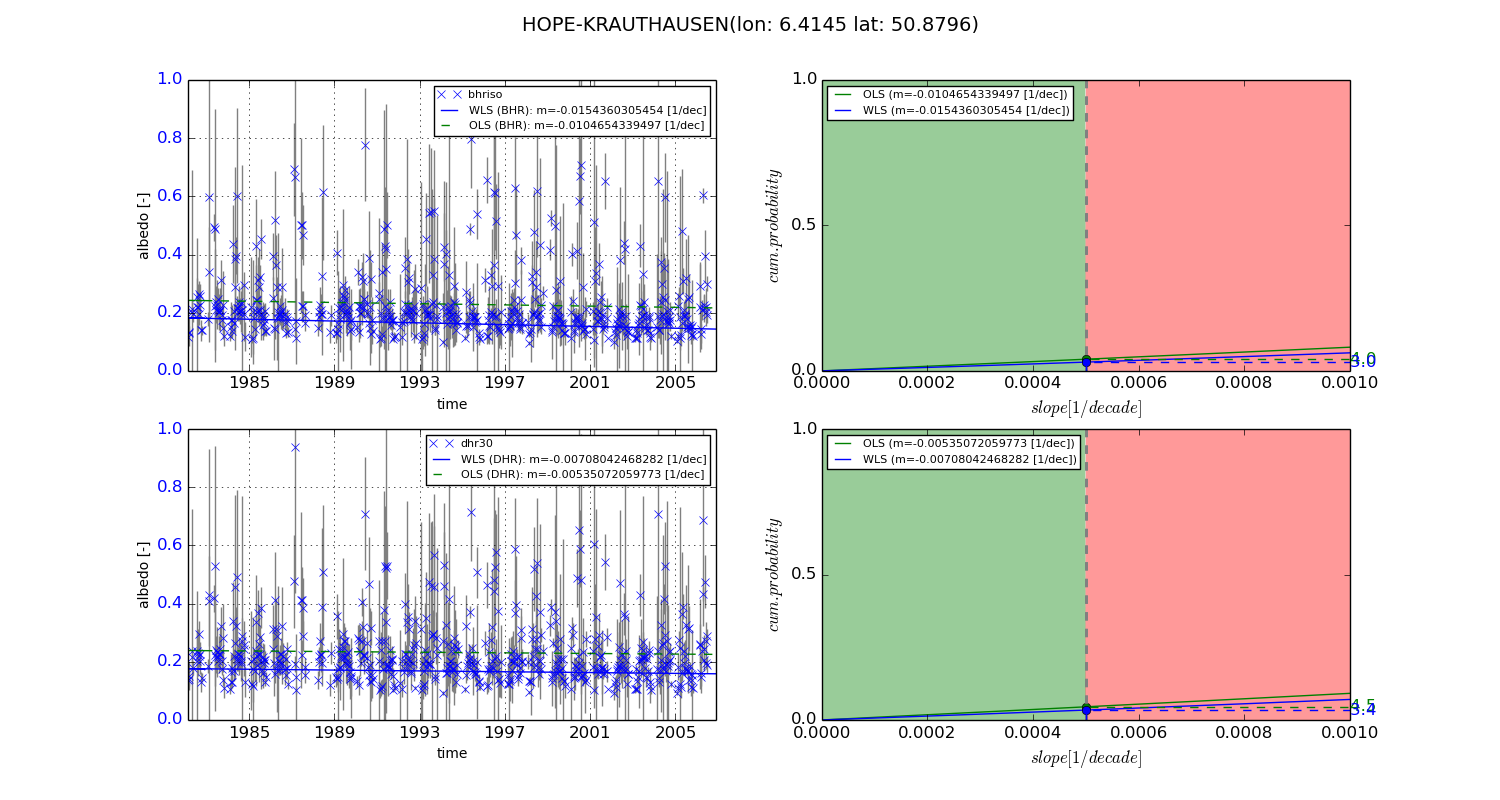
BHR statistics
|
Temporal stability [1/decade]:
|
|
Probabilities that GCOS criteria is met:
|
DHR statistics
|
Temporal stability [1/decade]:
|
|
Probabilities that GCOS criteria is met:
|
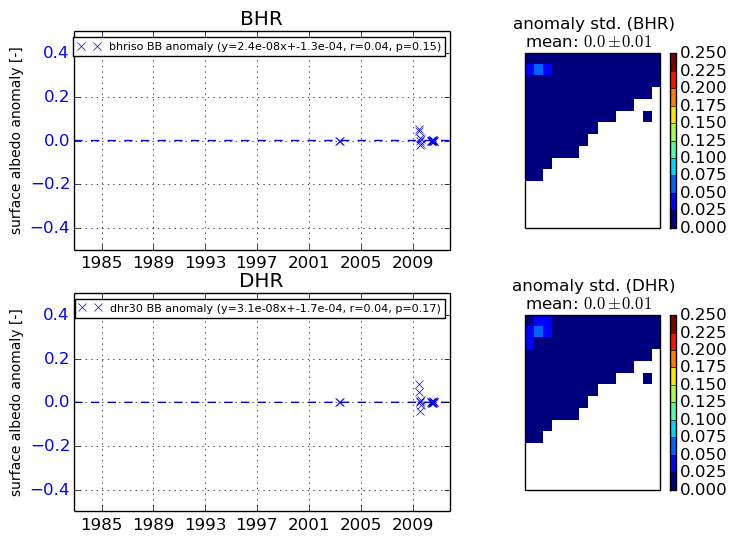
BHR statistics
|
Temporal stability [1/decade]:
|
|
Probabilities that GCOS criteria is met:
|
DHR statistics
|
Temporal stability [1/decade]:
|
|
Probabilities that GCOS criteria is met:
|
The variance of the temporal anomalies provides an additional measure about the stability of the signal AFTER removal of the mean seasonal cylce.