HOPE-MELPITZ


Location

lon / lat [deg]: 12.9276 / 51.5255

Source network: AERONET


Geostationary surface albedo (GSA) data


“+000”


“+057/+063”


Landcover information (based on ESA CCI landcover data)


Landcover fractions @ 2km distance


Landcover fractions @ 20 km distance


Legend


Distance to open water bodies [km]:

3.74

Distance to urban areas [km]:

1.43


Radius: 1 km

Number of landcover classes:

4

Dominant landcover type:

10: cropland, rainfed

Fraction of dominant landcover type [%]:

90.0


Radius: 2 km

Number of landcover classes:

4

Dominant landcover type:

10: cropland, rainfed

Fraction of dominant landcover type [%]:

56.0


Radius: 5 km

Number of landcover classes:

8

Dominant landcover type:

10: cropland, rainfed

Fraction of dominant landcover type [%]:

57.0


Radius: 10 km

Number of landcover classes:

8

Dominant landcover type:

10: cropland, rainfed

Fraction of dominant landcover type [%]:

64.0


Radius: 20 km

Number of landcover classes:

6

Dominant landcover type:

10: cropland, rainfed

Fraction of dominant landcover type [%]:

62.0


Disturbances


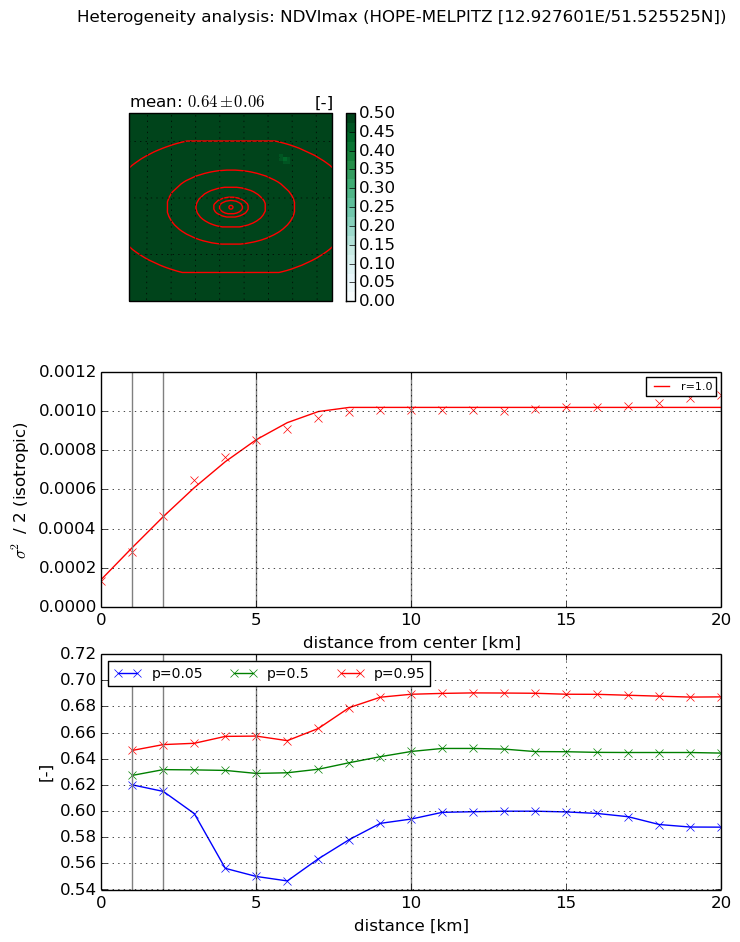
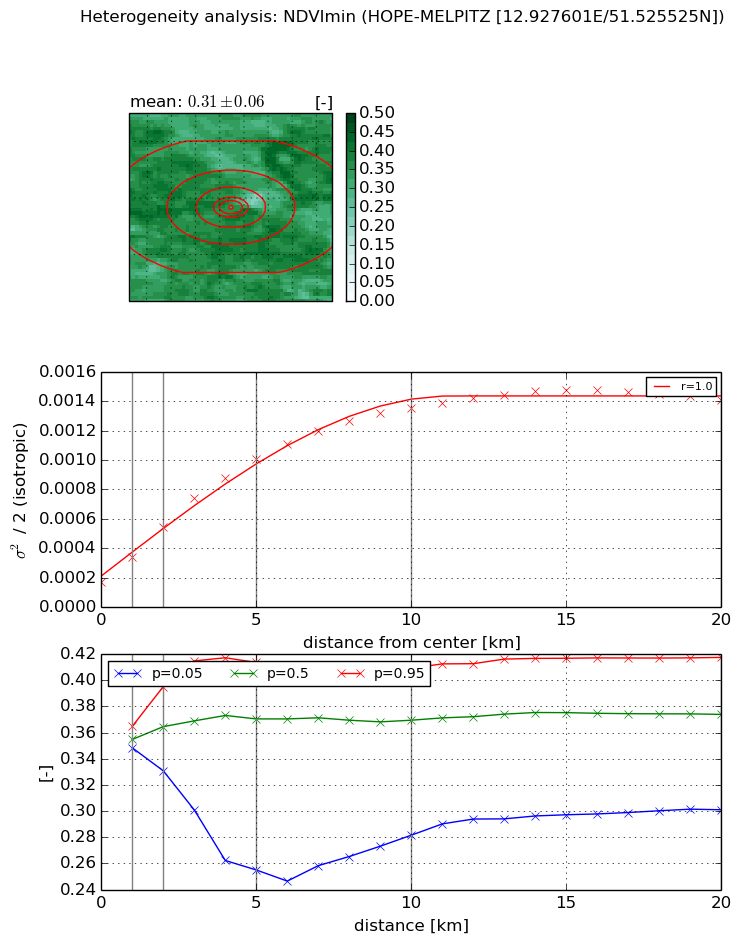
Heterogeneity analysis

The heterogeneity analysis provides information about the spatial and temporal heterogeneity of the site.

Topography


Roman et al. (2009) index


St

5.15899211861

Rcv

-0.0221503282842

Rse

0.0

Rst

-0.101973668121

Rsv

0.457384936159


Height range @ 1km [m]

3

Height range @ 2km [m]

18

Height range @ 5km [m]

23

Height range @ 10km [m]

-999

Height range @ 20km [m]

-999


Variance slope @ 1 km

28

Variance slope @ 2 km

26

Variance slope @ 5 km

15

Variance slope @ 10 km

-999

Variance slope @ 20 km

-999


NDVI (max. NDVI composite)


Roman et al. (2009) index


St

0.770931027548

Rcv

0.85841766785

Rse

0.0

Rst

-0.395755830849

Rsv

2.63722520339


NDVI range @ 1km [-]

0.03

NDVI range @ 2km [-]

0.04

NDVI range @ 5km [-]

0.11

NDVI range @ 10km [-]

0.1

NDVI range @ 20km [-]

0.1


Variance slope @ 1 km

0.000148217247367

Variance slope @ 2 km

0.000166350443395

Variance slope @ 5 km

0.000148898575977

Variance slope @ 10 km

8.7265348251e-05

Variance slope @ 20 km

3.4593816908e-05


NDVI (min. NDVI composite)I


Roman et al. (2009) index


St

6.08521219244

Rcv

0.330682326625

Rse

0.0

Rst

0.00171953031367

Rsv

0.160596563679


NDVI range @ 1km [-]

0.02

NDVI range @ 2km [-]

0.06

NDVI range @ 5km [-]

0.16

NDVI range @ 10km [-]

0.13

NDVI range @ 20km [-]

0.12


NDVI slope @ 1 km

0.000173661925956

NDVI slope @ 2 km

0.000188110457117

NDVI slope @ 5 km

0.000171043828149

NDVI slope @ 10 km

0.000119297565455

NDVI slope @ 20 km

5.573774626e-05


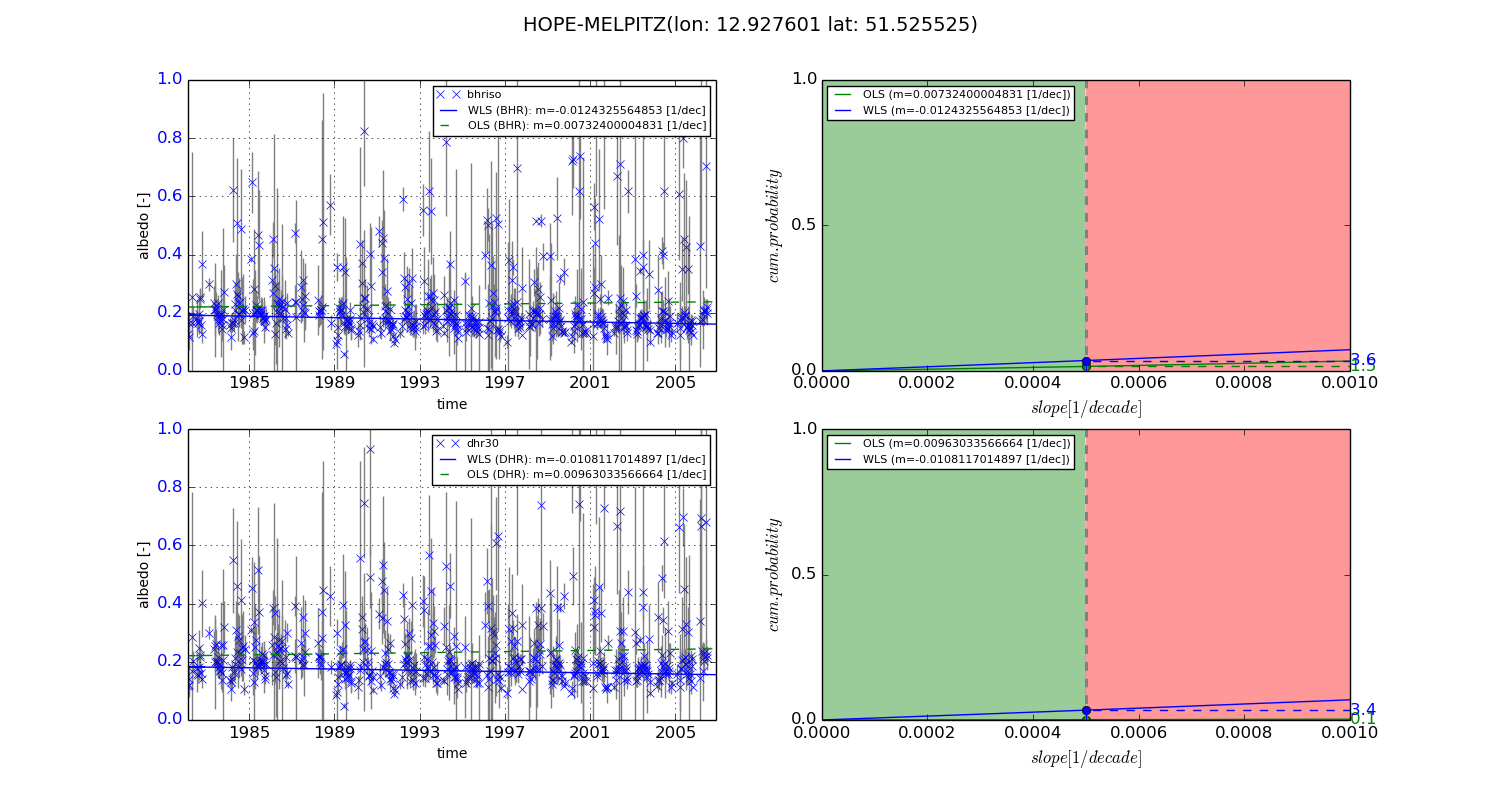
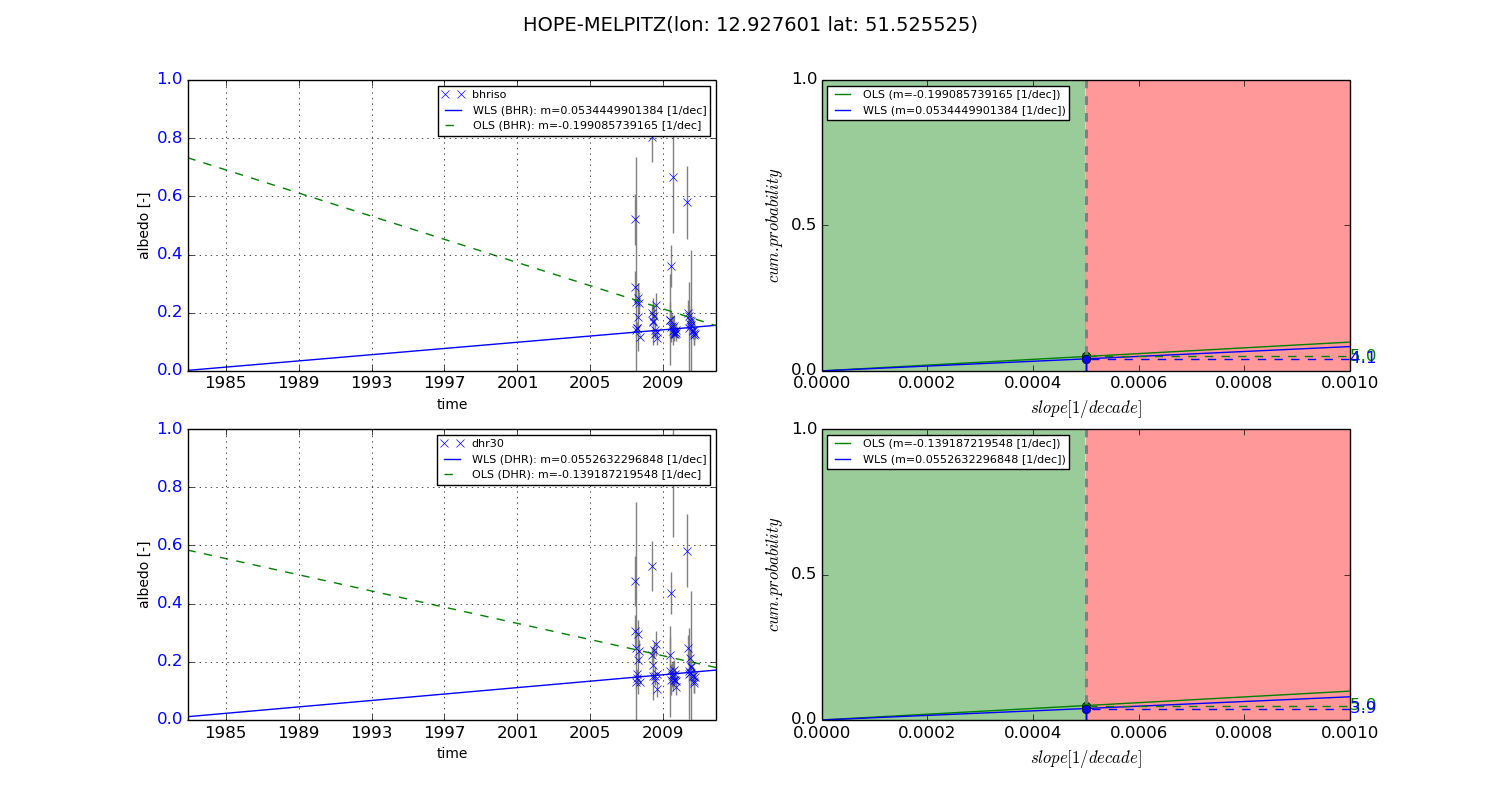
Temporal stability analysis

+000 deg (BHR)


BHR statistics

Temporal stability [1/decade]:


abs

rel


Weighted least square:

-0.0124325564853


Ordinary least square:

0.00732400004831


Probabilities that GCOS criteria is met:

Weighted least square:

3.6 %

Ordinary least square:

1.5 %


DHR statistics

Temporal stability [1/decade]:


abs

rel


Weighted least square:

-0.0108117014897


Ordinary least square:

0.00963033566664


Probabilities that GCOS criteria is met:

Weighted least square:

3.4 %

Ordinary least square:

0.1 %


+057/+063 deg (BHR)


BHR statistics

Temporal stability [1/decade]:


abs

rel


Weighted least square:

0.0534449901384


Ordinary least square:

-0.199085739165


Probabilities that GCOS criteria is met:

Weighted least square:

4.1 %

Ordinary least square:

5.0 %


DHR statistics

Temporal stability [1/decade]:


abs

rel


Weighted least square:

0.0552632296848


Ordinary least square:

-0.139187219548


Probabilities that GCOS criteria is met:

Weighted least square:

3.9 %

Ordinary least square:

5.0 %


Temporal anomaly analyis

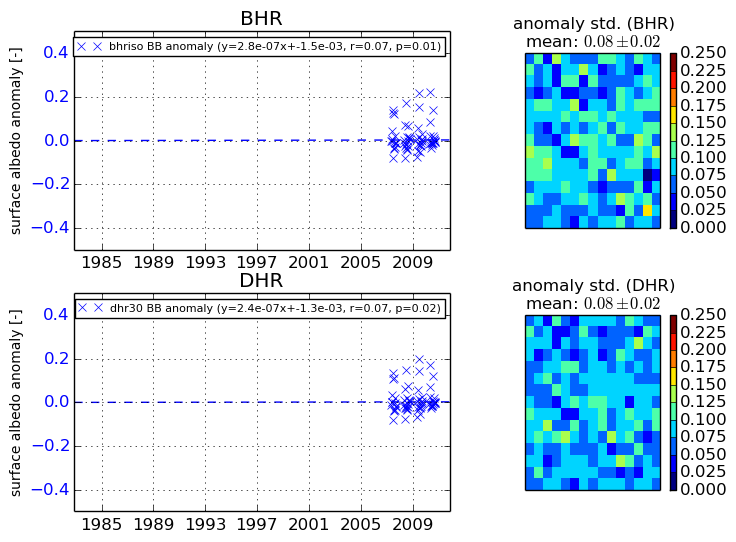
The variance of the temporal anomalies provides an additional measure about the stability of the signal AFTER removal of the mean seasonal cylce.
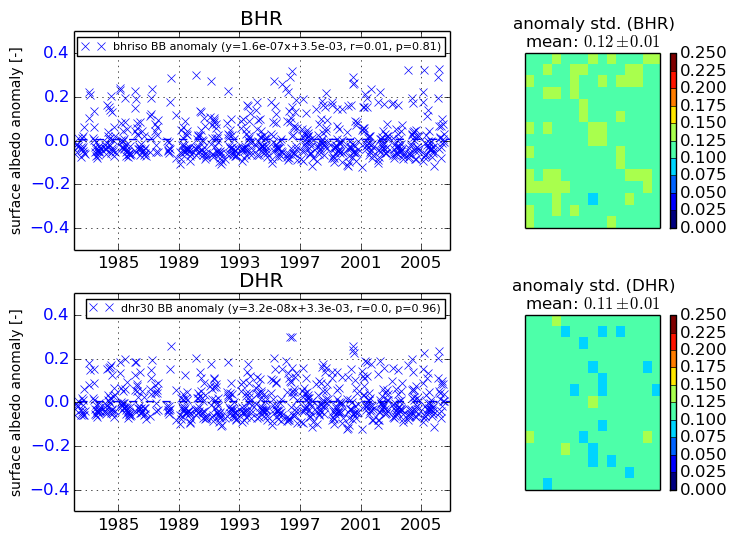
+000 deg


+057/+063 deg