HOPE-RWTH-AACHEN


Location

lon / lat [deg]: 6.0606 / 50.7777

Source network: AERONET


Geostationary surface albedo (GSA) data


“+000”


“+057/+063”


Landcover information (based on ESA CCI landcover data)


Landcover fractions @ 2km distance


Landcover fractions @ 20 km distance


Legend


Distance to open water bodies [km]:

15.37

Distance to urban areas [km]:

0.16


Radius: 1 km

Number of landcover classes:

1

Dominant landcover type:

190: urban areas

Fraction of dominant landcover type [%]:

100.0


Radius: 2 km

Number of landcover classes:

3

Dominant landcover type:

190: urban areas

Fraction of dominant landcover type [%]:

90.0


Radius: 5 km

Number of landcover classes:

6

Dominant landcover type:

190: urban areas

Fraction of dominant landcover type [%]:

58.0


Radius: 10 km

Number of landcover classes:

7

Dominant landcover type:

190: urban areas

Fraction of dominant landcover type [%]:

45.0


Radius: 20 km

Number of landcover classes:

7

Dominant landcover type:

190: urban areas

Fraction of dominant landcover type [%]:

37.0


Disturbances


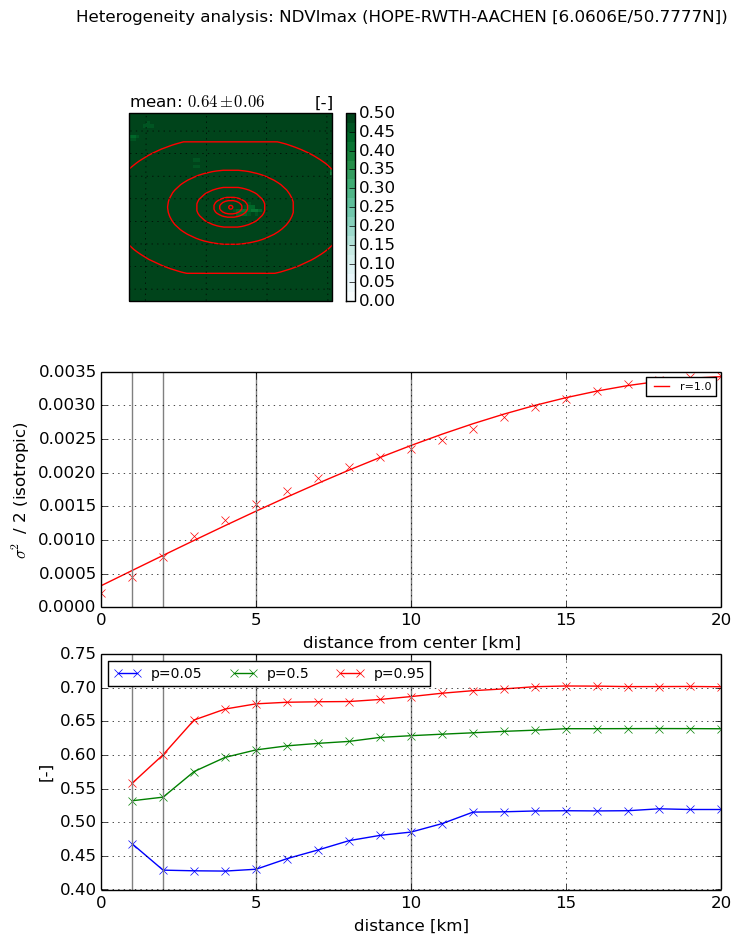
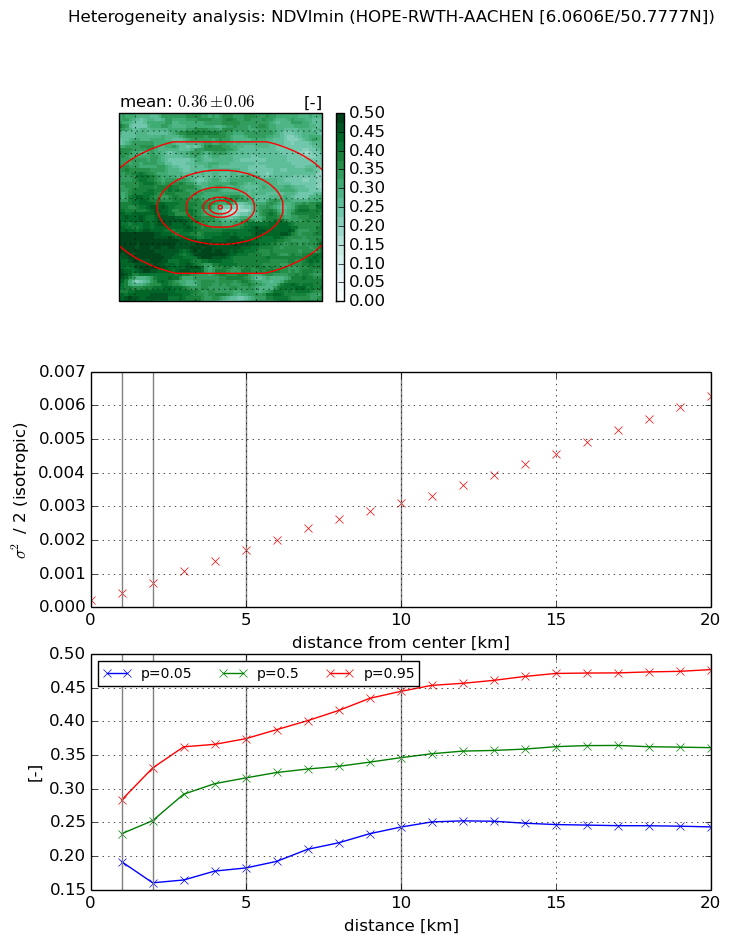
Heterogeneity analysis

The heterogeneity analysis provides information about the spatial and temporal heterogeneity of the site.

Topography


Roman et al. (2009) index


St

1.90192779998

Rcv

0.585981503573

Rse

0.0

Rst

-1.15381661149e-06

Rsv

-0.991364285032


Height range @ 1km [m]

40

Height range @ 2km [m]

62

Height range @ 5km [m]

163

Height range @ 10km [m]

-999

Height range @ 20km [m]

-999


Variance slope @ 1 km

520

Variance slope @ 2 km

489

Variance slope @ 5 km

400

Variance slope @ 10 km

-999

Variance slope @ 20 km

-999


NDVI (max. NDVI composite)


Roman et al. (2009) index


St

150.107313082

Rcv

-0.00592802537292

Rse

0.0

Rst

-0.00442643095291

Rsv

-0.0096312454924


NDVI range @ 1km [-]

0.09

NDVI range @ 2km [-]

0.17

NDVI range @ 5km [-]

0.25

NDVI range @ 10km [-]

0.2

NDVI range @ 20km [-]

0.18


Variance slope @ 1 km

0.000230299771354

Variance slope @ 2 km

0.000265097638311

Variance slope @ 5 km

0.000269710027627

Variance slope @ 10 km

0.000218175043926

Variance slope @ 20 km

0.000161552763434


NDVI (min. NDVI composite)I


Roman et al. (2009) index


St

10.9263406136

Rcv

-0.166872707252

Rse

0.0

Rst

-0.0365239558092

Rsv

0.0711691871263


NDVI range @ 1km [-]

0.09

NDVI range @ 2km [-]

0.17

NDVI range @ 5km [-]

0.19

NDVI range @ 10km [-]

0.2

NDVI range @ 20km [-]

0.23


NDVI slope @ 1 km

0.000222657977797

NDVI slope @ 2 km

0.000265608408778

NDVI slope @ 5 km

0.000306311820717

NDVI slope @ 10 km

0.000299629097522

NDVI slope @ 20 km

0.000299355526933


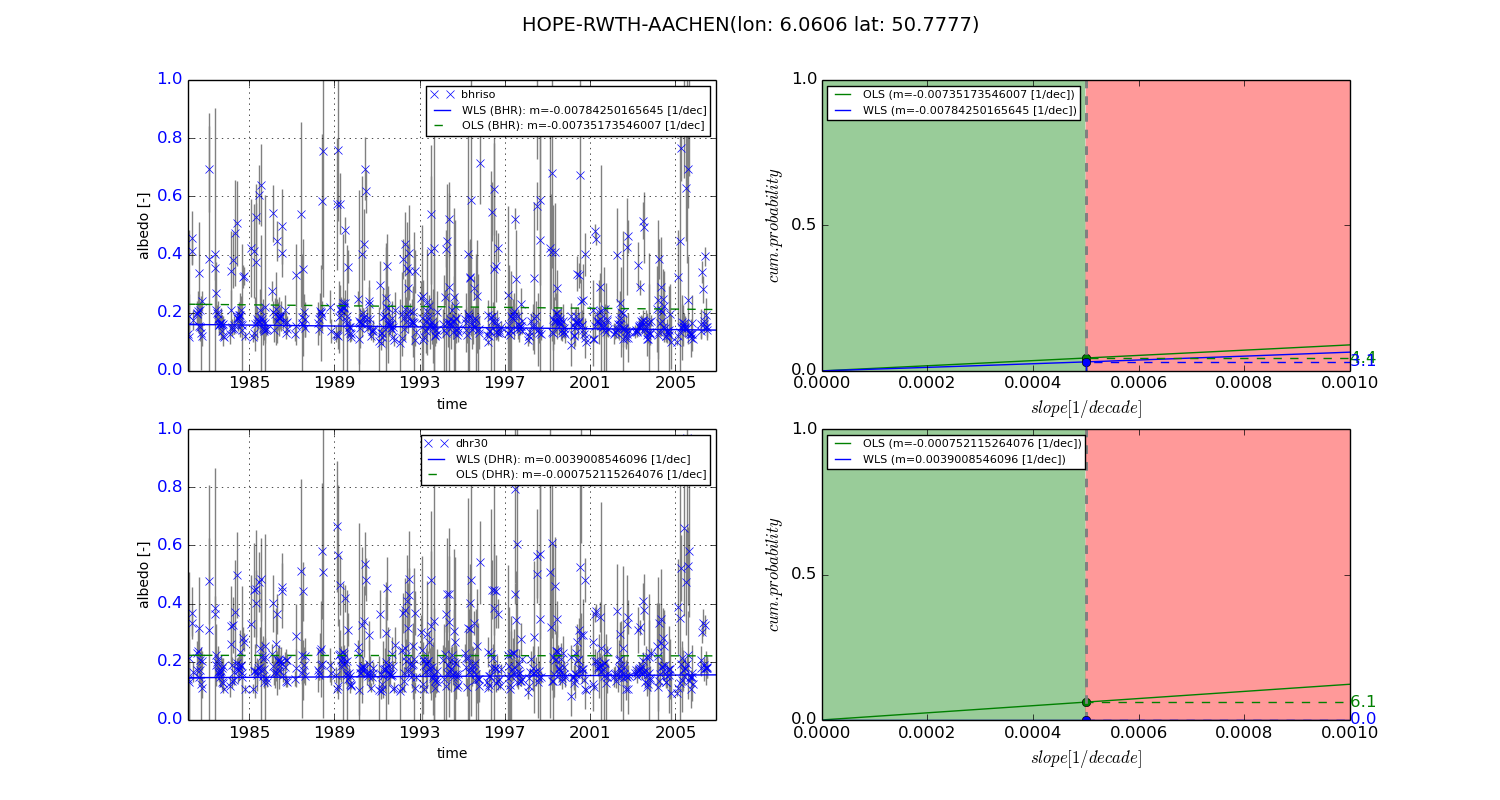
Temporal stability analysis

+000 deg (BHR)


BHR statistics

Temporal stability [1/decade]:


abs

rel


Weighted least square:

-0.00784250165645


Ordinary least square:

-0.00735173546007


Probabilities that GCOS criteria is met:

Weighted least square:

3.1 %

Ordinary least square:

4.4 %


DHR statistics

Temporal stability [1/decade]:


abs

rel


Weighted least square:

0.0039008546096


Ordinary least square:

-0.000752115264076


Probabilities that GCOS criteria is met:

Weighted least square:

0.0 %

Ordinary least square:

6.1 %


+057/+063 deg (BHR)


BHR statistics

Temporal stability [1/decade]:


abs

rel


Weighted least square:

-99999.0


Ordinary least square:

-99999.0


Probabilities that GCOS criteria is met:

Weighted least square:

-99999.0 %

Ordinary least square:

-99999.0 %


DHR statistics

Temporal stability [1/decade]:


abs

rel


Weighted least square:

-99999.0


Ordinary least square:

-99999.0


Probabilities that GCOS criteria is met:

Weighted least square:

-99999.0 %

Ordinary least square:

-99999.0 %


Temporal anomaly analyis

The variance of the temporal anomalies provides an additional measure about the stability of the signal AFTER removal of the mean seasonal cylce.
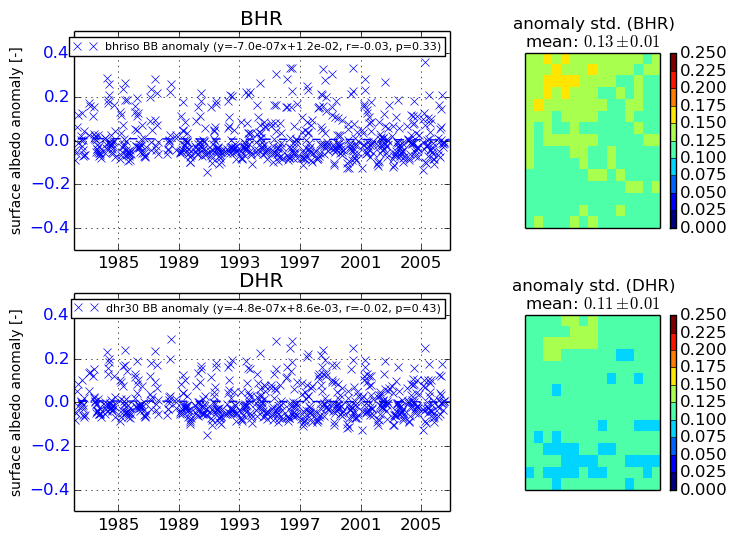
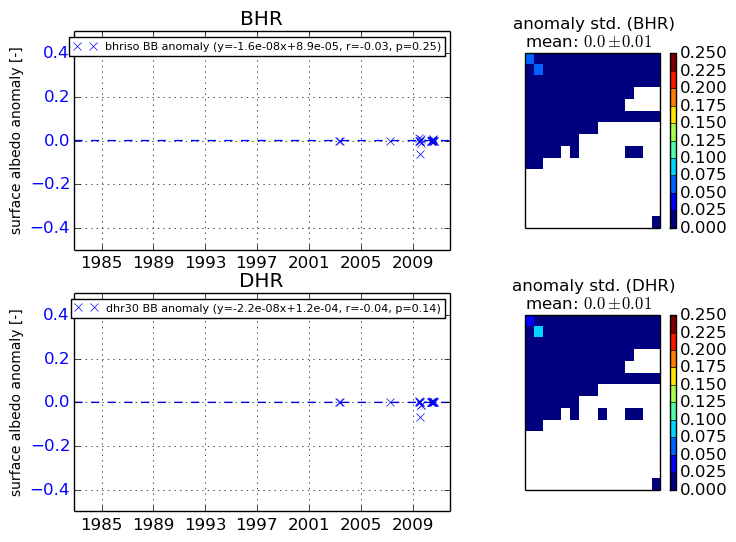
+000 deg


+057/+063 deg