HOTAN


Location

lon / lat [deg]: 79.9333 / 37.1333

Source network: AERONET


Geostationary surface albedo (GSA) data


“+000”


“+057/+063”


Landcover information (based on ESA CCI landcover data)


Landcover fractions @ 2km distance


Landcover fractions @ 20 km distance


Legend


Distance to open water bodies [km]:

3.97

Distance to urban areas [km]:

0.2


Radius: 1 km

Number of landcover classes:

3

Dominant landcover type:

190: urban areas

Fraction of dominant landcover type [%]:

93.0


Radius: 2 km

Number of landcover classes:

4

Dominant landcover type:

190: urban areas

Fraction of dominant landcover type [%]:

72.0


Radius: 5 km

Number of landcover classes:

6

Dominant landcover type:

10: cropland, rainfed

Fraction of dominant landcover type [%]:

38.0


Radius: 10 km

Number of landcover classes:

5

Dominant landcover type:

10: cropland, rainfed

Fraction of dominant landcover type [%]:

43.0


Radius: 20 km

Number of landcover classes:

5

Dominant landcover type:

20: cropland, irrigated or post-flooded

Fraction of dominant landcover type [%]:

32.0


Disturbances


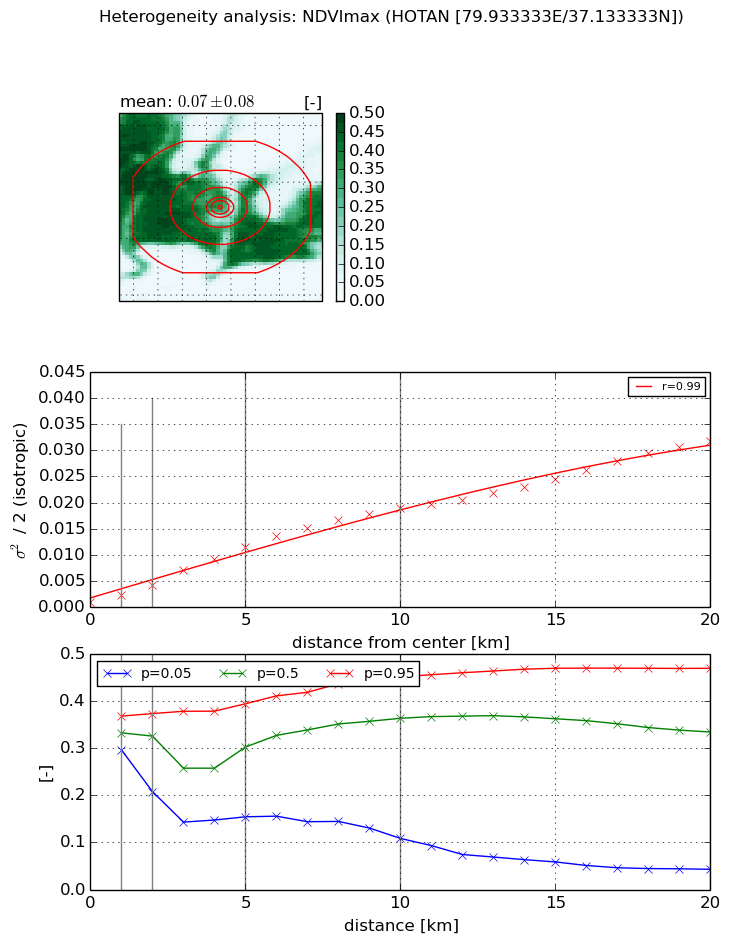
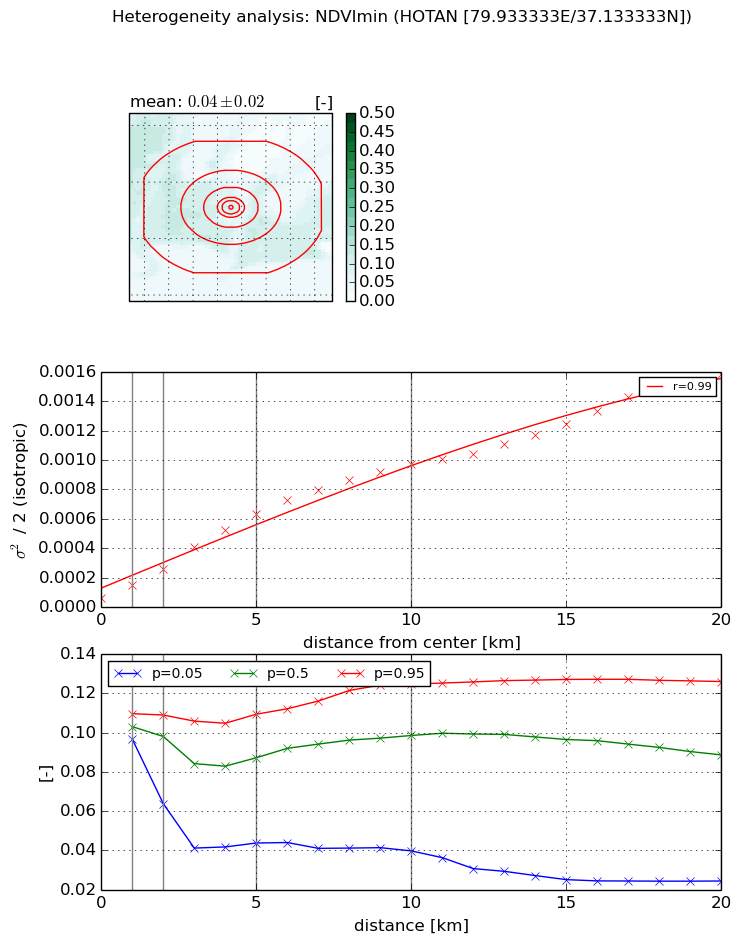
Heterogeneity analysis

The heterogeneity analysis provides information about the spatial and temporal heterogeneity of the site.

Topography


Roman et al. (2009) index


St

2.01222727174

Rcv

0.490933038969

Rse

0.0

Rst

-6.57084840761e-06

Rsv

-0.999945660516


Height range @ 1km [m]

15

Height range @ 2km [m]

33

Height range @ 5km [m]

63

Height range @ 10km [m]

-999

Height range @ 20km [m]

-999


Variance slope @ 1 km

19

Variance slope @ 2 km

31

Variance slope @ 5 km

72

Variance slope @ 10 km

-999

Variance slope @ 20 km

-999


NDVI (max. NDVI composite)


Roman et al. (2009) index


St

9.17915914915

Rcv

-0.0405538497252

Rse

0.0

Rst

0.0597922238032

Rsv

-0.226481248152


NDVI range @ 1km [-]

0.07

NDVI range @ 2km [-]

0.17

NDVI range @ 5km [-]

0.24

NDVI range @ 10km [-]

0.34

NDVI range @ 20km [-]

0.43


Variance slope @ 1 km

0.00140736563398

Variance slope @ 2 km

0.00163618935742

Variance slope @ 5 km

0.0021881477119

Variance slope @ 10 km

0.00190985397467

Variance slope @ 20 km

0.00148590513417


NDVI (min. NDVI composite)I


Roman et al. (2009) index


St

6.38572095784

Rcv

-0.0393549063739

Rse

0.0

Rst

0.159740889568

Rsv

-0.270702370907


NDVI range @ 1km [-]

0.01

NDVI range @ 2km [-]

0.05

NDVI range @ 5km [-]

0.07

NDVI range @ 10km [-]

0.09

NDVI range @ 20km [-]

0.1


NDVI slope @ 1 km

8.7506562991e-05

NDVI slope @ 2 km

9.81382559616e-05

NDVI slope @ 5 km

0.000118558366444

NDVI slope @ 10 km

9.4714887246e-05

NDVI slope @ 20 km

7.26429317193e-05


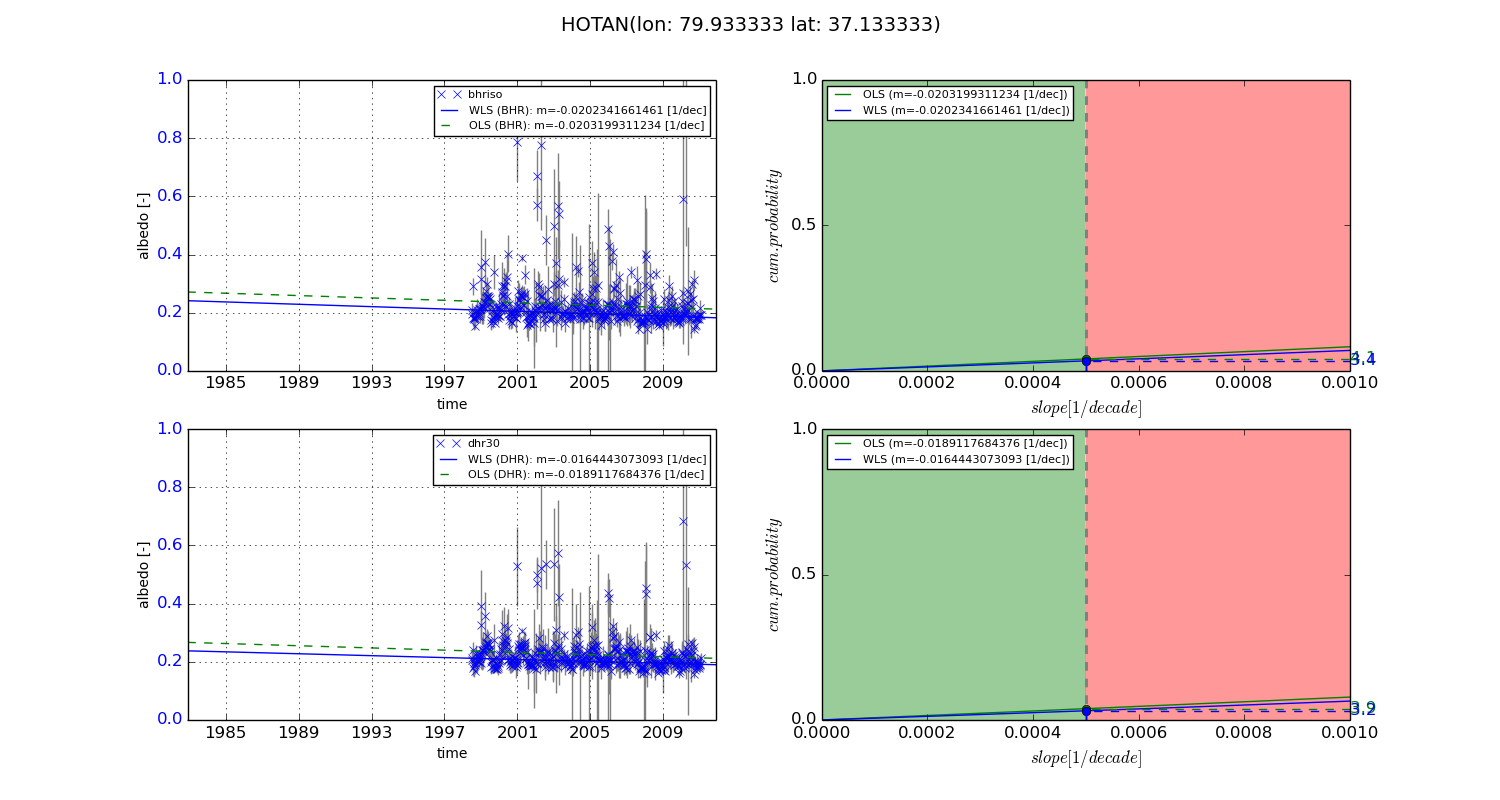
Temporal stability analysis

+000 deg (BHR)


BHR statistics

Temporal stability [1/decade]:


abs

rel


Weighted least square:

None


Ordinary least square:

None


Probabilities that GCOS criteria is met:

Weighted least square:

None %

Ordinary least square:

None %


DHR statistics

Temporal stability [1/decade]:


abs

rel


Weighted least square:

None


Ordinary least square:

None


Probabilities that GCOS criteria is met:

Weighted least square:

None %

Ordinary least square:

None %


+057/+063 deg (BHR)


BHR statistics

Temporal stability [1/decade]:


abs

rel


Weighted least square:

-0.0202341661461


Ordinary least square:

-0.0203199311234


Probabilities that GCOS criteria is met:

Weighted least square:

3.4 %

Ordinary least square:

4.1 %


DHR statistics

Temporal stability [1/decade]:


abs

rel


Weighted least square:

-0.0164443073093


Ordinary least square:

-0.0189117684376


Probabilities that GCOS criteria is met:

Weighted least square:

3.2 %

Ordinary least square:

3.9 %


Temporal anomaly analyis

The variance of the temporal anomalies provides an additional measure about the stability of the signal AFTER removal of the mean seasonal cylce.

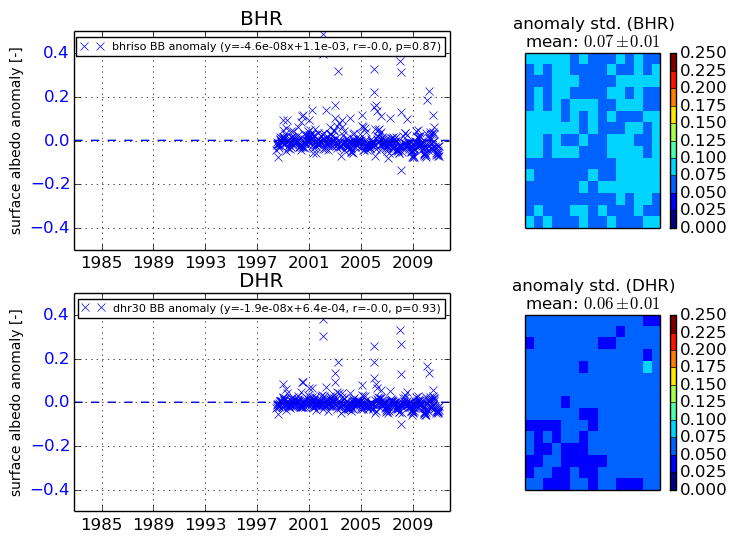
+000 deg


+057/+063 deg