HU-BUG


Location

lon / lat [deg]: 19.6013 / 46.6911

Source network: FLUXNET


Geostationary surface albedo (GSA) data


“+000”


“+057/+063”


Landcover information (based on ESA CCI landcover data)


Landcover fractions @ 2km distance


Landcover fractions @ 20 km distance


Legend


Distance to open water bodies [km]:

2.36

Distance to urban areas [km]:

2.49


Radius: 1 km

Number of landcover classes:

3

Dominant landcover type:

10: cropland, rainfed

Fraction of dominant landcover type [%]:

85.0


Radius: 2 km

Number of landcover classes:

8

Dominant landcover type:

10: cropland, rainfed

Fraction of dominant landcover type [%]:

62.0


Radius: 5 km

Number of landcover classes:

8

Dominant landcover type:

10: cropland, rainfed

Fraction of dominant landcover type [%]:

68.0


Radius: 10 km

Number of landcover classes:

10

Dominant landcover type:

10: cropland, rainfed

Fraction of dominant landcover type [%]:

68.0


Radius: 20 km

Number of landcover classes:

10

Dominant landcover type:

10: cropland, rainfed

Fraction of dominant landcover type [%]:

69.0


Disturbances


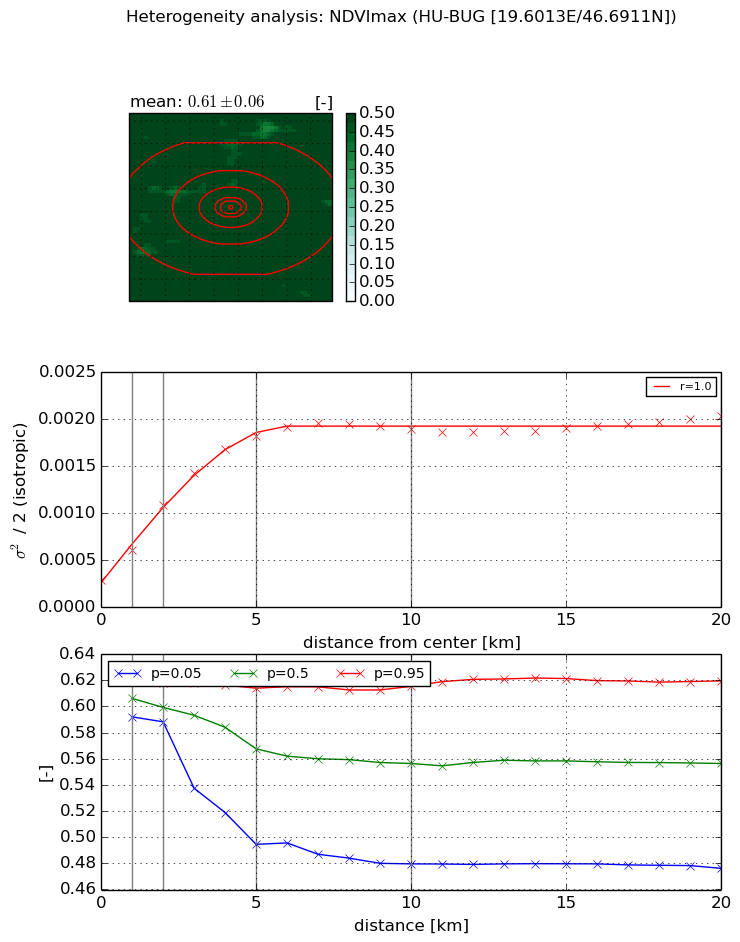
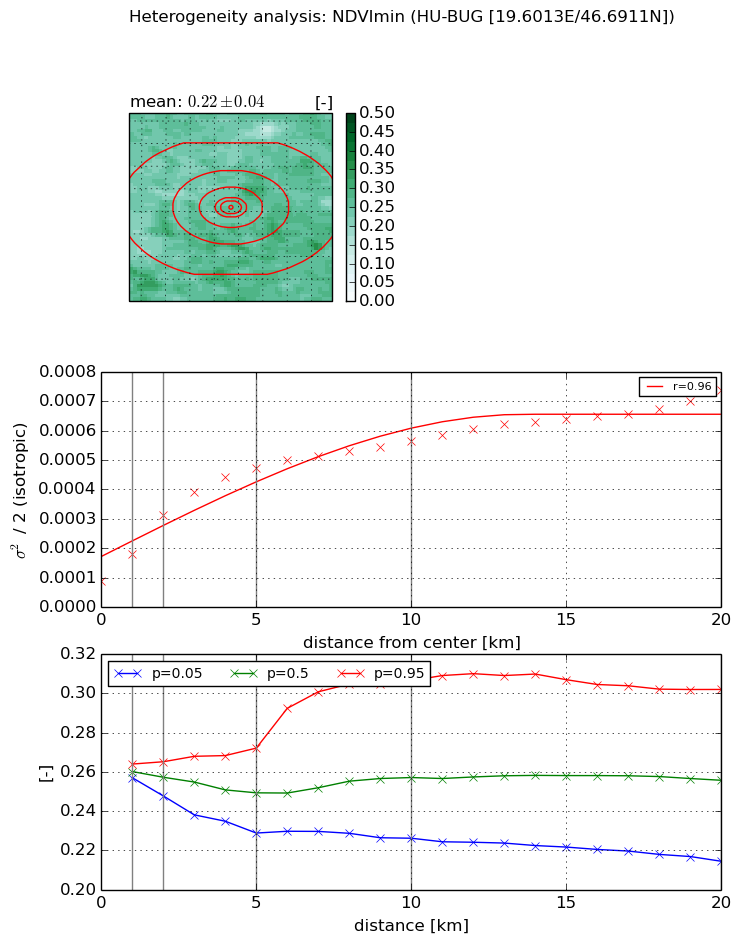
Heterogeneity analysis

The heterogeneity analysis provides information about the spatial and temporal heterogeneity of the site.

Topography


Roman et al. (2009) index


St

4.73268402817

Rcv

-0.026904858517

Rse

0.0

Rst

-0.0992009737719

Rsv

0.507783939803


Height range @ 1km [m]

8

Height range @ 2km [m]

11

Height range @ 5km [m]

11

Height range @ 10km [m]

-999

Height range @ 20km [m]

-999


Variance slope @ 1 km

6

Variance slope @ 2 km

4

Variance slope @ 5 km

1

Variance slope @ 10 km

-999

Variance slope @ 20 km

-999


NDVI (max. NDVI composite)


Roman et al. (2009) index


St

1.44718631992e-07

Rcv

0.532756652006

Rse

0.0

Rst

-0.0741973431748

Rsv

20729880.257


NDVI range @ 1km [-]

0.03

NDVI range @ 2km [-]

0.03

NDVI range @ 5km [-]

0.12

NDVI range @ 10km [-]

0.14

NDVI range @ 20km [-]

0.14


Variance slope @ 1 km

0.000321195688999

Variance slope @ 2 km

0.000400180911992

Variance slope @ 5 km

0.000320233699774

Variance slope @ 10 km

0.000155991593604

Variance slope @ 20 km

5.44620895188e-05


NDVI (min. NDVI composite)I


Roman et al. (2009) index


St

1.56142992904

Rcv

0.625467354404

Rse

0.0

Rst

-0.295848581082

Rsv

-0.999999868826


NDVI range @ 1km [-]

0.01

NDVI range @ 2km [-]

0.02

NDVI range @ 5km [-]

0.04

NDVI range @ 10km [-]

0.08

NDVI range @ 20km [-]

0.09


NDVI slope @ 1 km

9.45325901861e-05

NDVI slope @ 2 km

0.000112379054795

NDVI slope @ 5 km

7.98834775553e-05

NDVI slope @ 10 km

4.36254197136e-05

NDVI slope @ 20 km

2.47387977168e-05


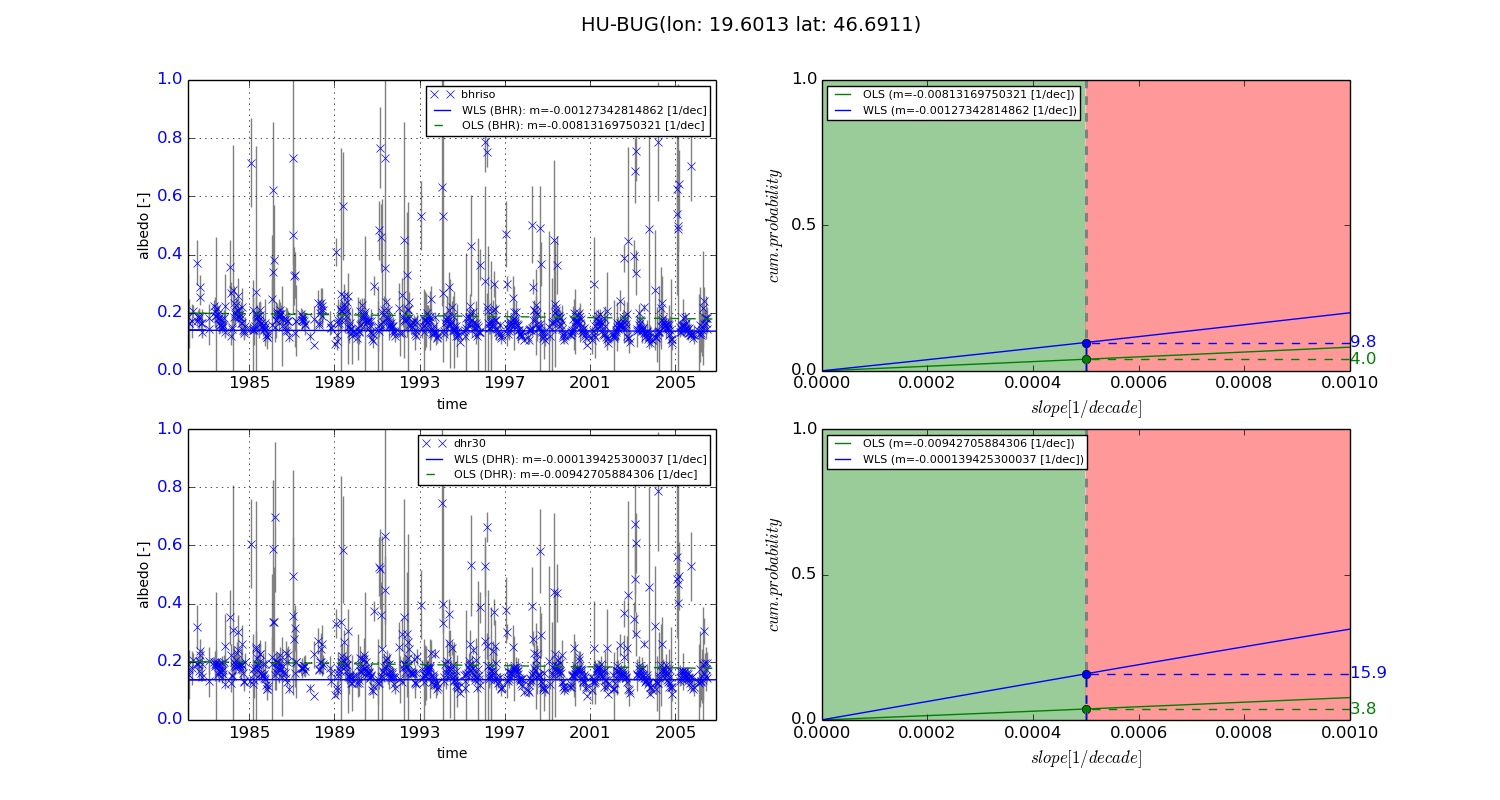
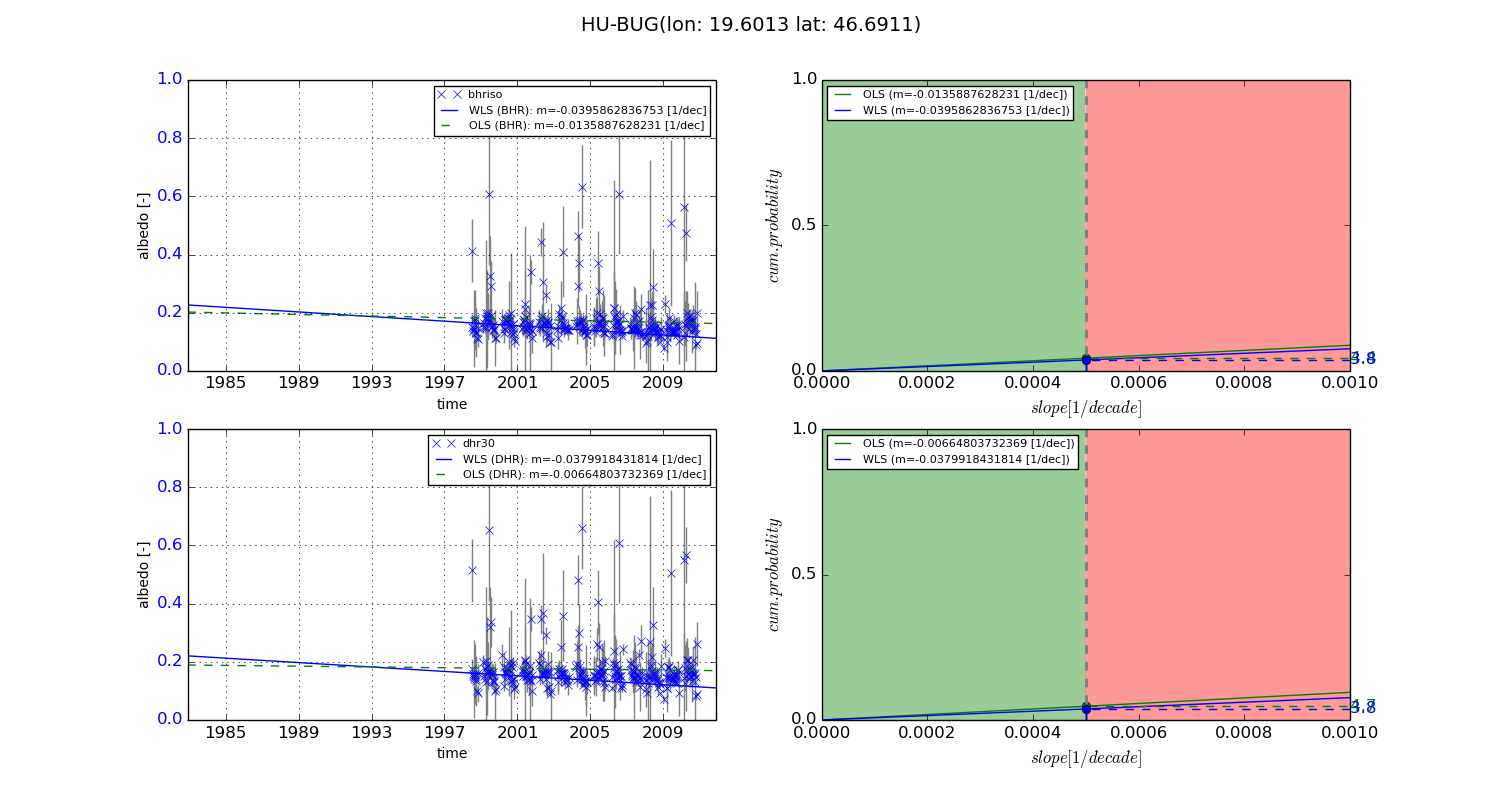
Temporal stability analysis

+000 deg (BHR)


BHR statistics

Temporal stability [1/decade]:


abs

rel


Weighted least square:

-0.00127342814862


Ordinary least square:

-0.00813169750321


Probabilities that GCOS criteria is met:

Weighted least square:

9.8 %

Ordinary least square:

4.0 %


DHR statistics

Temporal stability [1/decade]:


abs

rel


Weighted least square:

-0.000139425300037


Ordinary least square:

-0.00942705884306


Probabilities that GCOS criteria is met:

Weighted least square:

15.9 %

Ordinary least square:

3.8 %


+057/+063 deg (BHR)


BHR statistics

Temporal stability [1/decade]:


abs

rel


Weighted least square:

-0.0395862836753


Ordinary least square:

-0.0135887628231


Probabilities that GCOS criteria is met:

Weighted least square:

3.8 %

Ordinary least square:

4.4 %


DHR statistics

Temporal stability [1/decade]:


abs

rel


Weighted least square:

-0.0379918431814


Ordinary least square:

-0.00664803732369


Probabilities that GCOS criteria is met:

Weighted least square:

3.8 %

Ordinary least square:

4.7 %


Temporal anomaly analyis

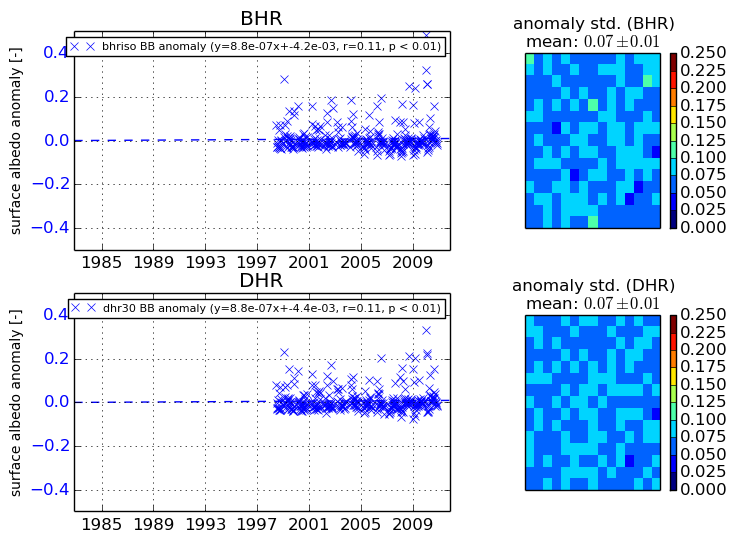
The variance of the temporal anomalies provides an additional measure about the stability of the signal AFTER removal of the mean seasonal cylce.
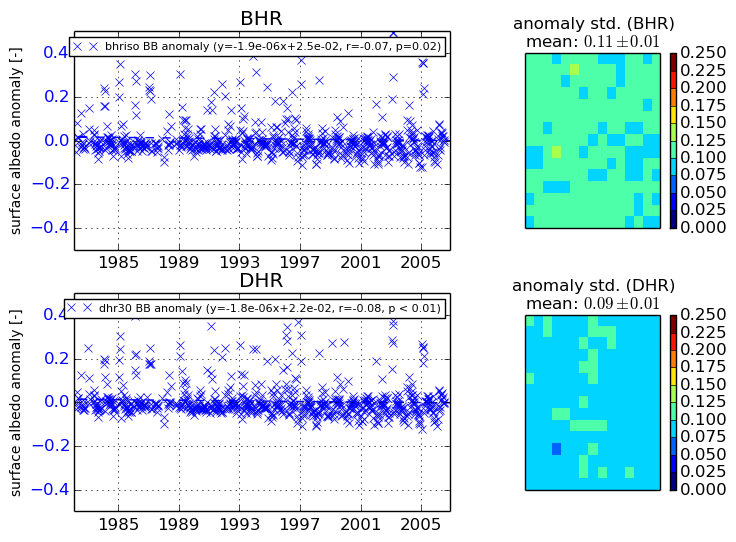
+000 deg


+057/+063 deg