HU-MAT


Location

lon / lat [deg]: 19.726 / 47.8469

Source network: FLUXNET


Geostationary surface albedo (GSA) data


“+000”


“+057/+063”


Landcover information (based on ESA CCI landcover data)


Landcover fractions @ 2km distance


Landcover fractions @ 20 km distance


Legend


Distance to open water bodies [km]:

7.43

Distance to urban areas [km]:

0.82


Radius: 1 km

Number of landcover classes:

5

Dominant landcover type:

10: cropland, rainfed

Fraction of dominant landcover type [%]:

54.0


Radius: 2 km

Number of landcover classes:

9

Dominant landcover type:

60: Tree cover, broadleaved, decidous

Fraction of dominant landcover type [%]:

43.0


Radius: 5 km

Number of landcover classes:

7

Dominant landcover type:

10: cropland, rainfed

Fraction of dominant landcover type [%]:

48.0


Radius: 10 km

Number of landcover classes:

4

Dominant landcover type:

10: cropland, rainfed

Fraction of dominant landcover type [%]:

53.0


Radius: 20 km

Number of landcover classes:

4

Dominant landcover type:

10: cropland, rainfed

Fraction of dominant landcover type [%]:

52.0


Disturbances


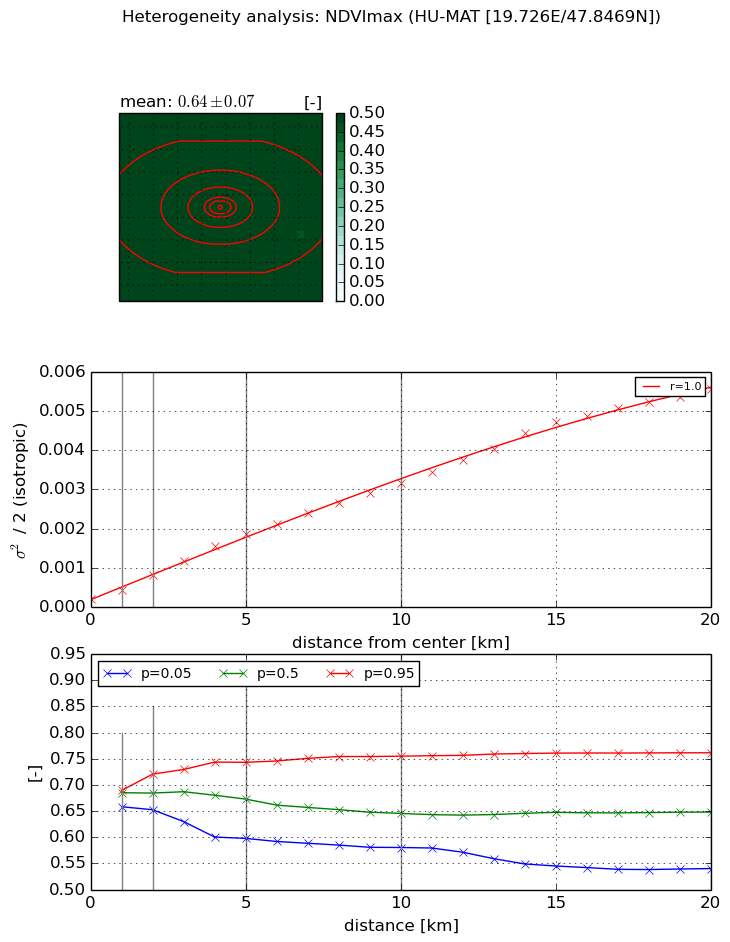
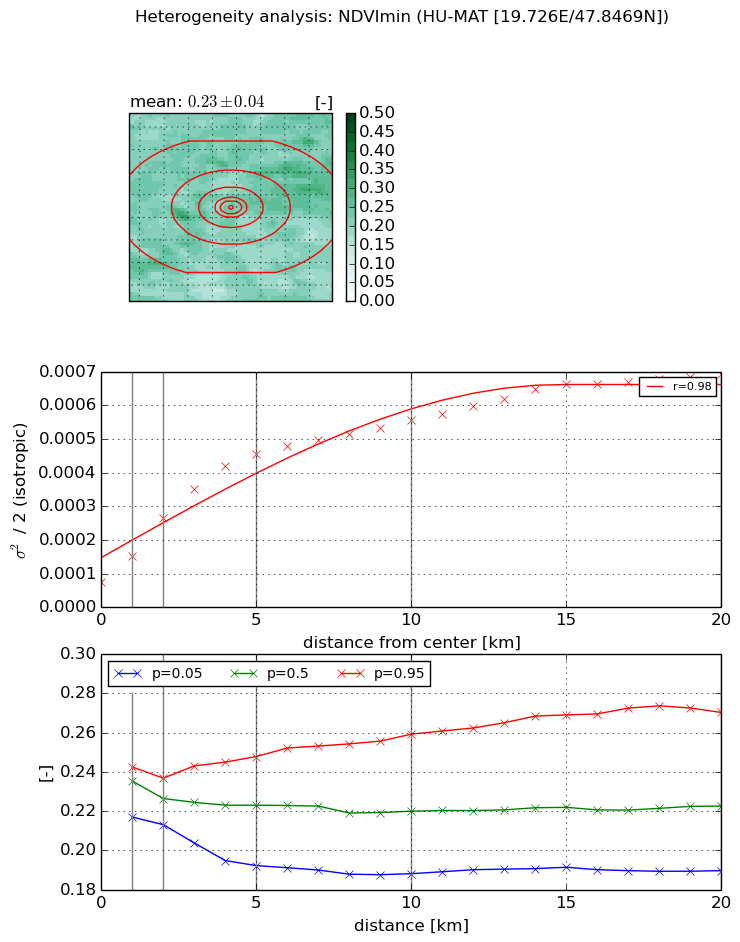
Heterogeneity analysis

The heterogeneity analysis provides information about the spatial and temporal heterogeneity of the site.

Topography


Roman et al. (2009) index


St

3.54197910894

Rcv

0.419789837743

Rse

0.0

Rst

-0.018357829

Rsv

0.408836436701


Height range @ 1km [m]

157

Height range @ 2km [m]

239

Height range @ 5km [m]

348

Height range @ 10km [m]

-999

Height range @ 20km [m]

-999


Variance slope @ 1 km

2791

Variance slope @ 2 km

3334

Variance slope @ 5 km

3206

Variance slope @ 10 km

-999

Variance slope @ 20 km

-999


NDVI (max. NDVI composite)


Roman et al. (2009) index


St

1.07419886645

Rcv

0.515675446835

Rse

0.0

Rst

-0.285171785423

Rsv

1.99193173419


NDVI range @ 1km [-]

0.03

NDVI range @ 2km [-]

0.07

NDVI range @ 5km [-]

0.15

NDVI range @ 10km [-]

0.17

NDVI range @ 20km [-]

0.22


Variance slope @ 1 km

0.000232475318447

Variance slope @ 2 km

0.000308764199203

Variance slope @ 5 km

0.000343824403968

Variance slope @ 10 km

0.000302388148329

Variance slope @ 20 km

0.000275005249334


NDVI (min. NDVI composite)I


Roman et al. (2009) index


St

2.26318298544e-07

Rcv

0.297982814667

Rse

0.0

Rst

0.172023069564

Rsv

13255666.5233


NDVI range @ 1km [-]

0.03

NDVI range @ 2km [-]

0.02

NDVI range @ 5km [-]

0.06

NDVI range @ 10km [-]

0.07

NDVI range @ 20km [-]

0.08


NDVI slope @ 1 km

7.69047233403e-05

NDVI slope @ 2 km

9.46904391899e-05

NDVI slope @ 5 km

7.95006270466e-05

NDVI slope @ 10 km

4.56861706134e-05

NDVI slope @ 20 km

2.63275867027e-05


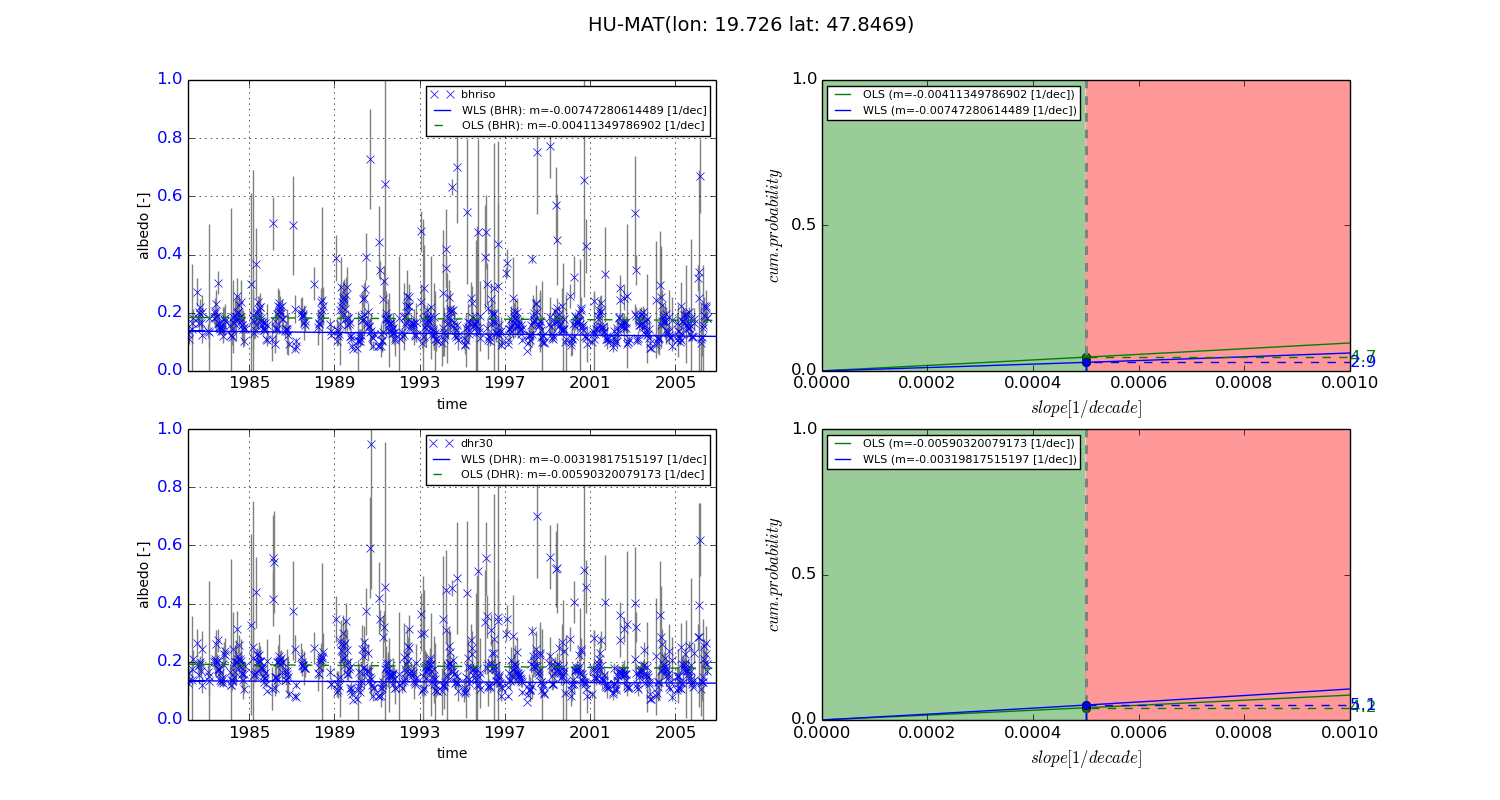
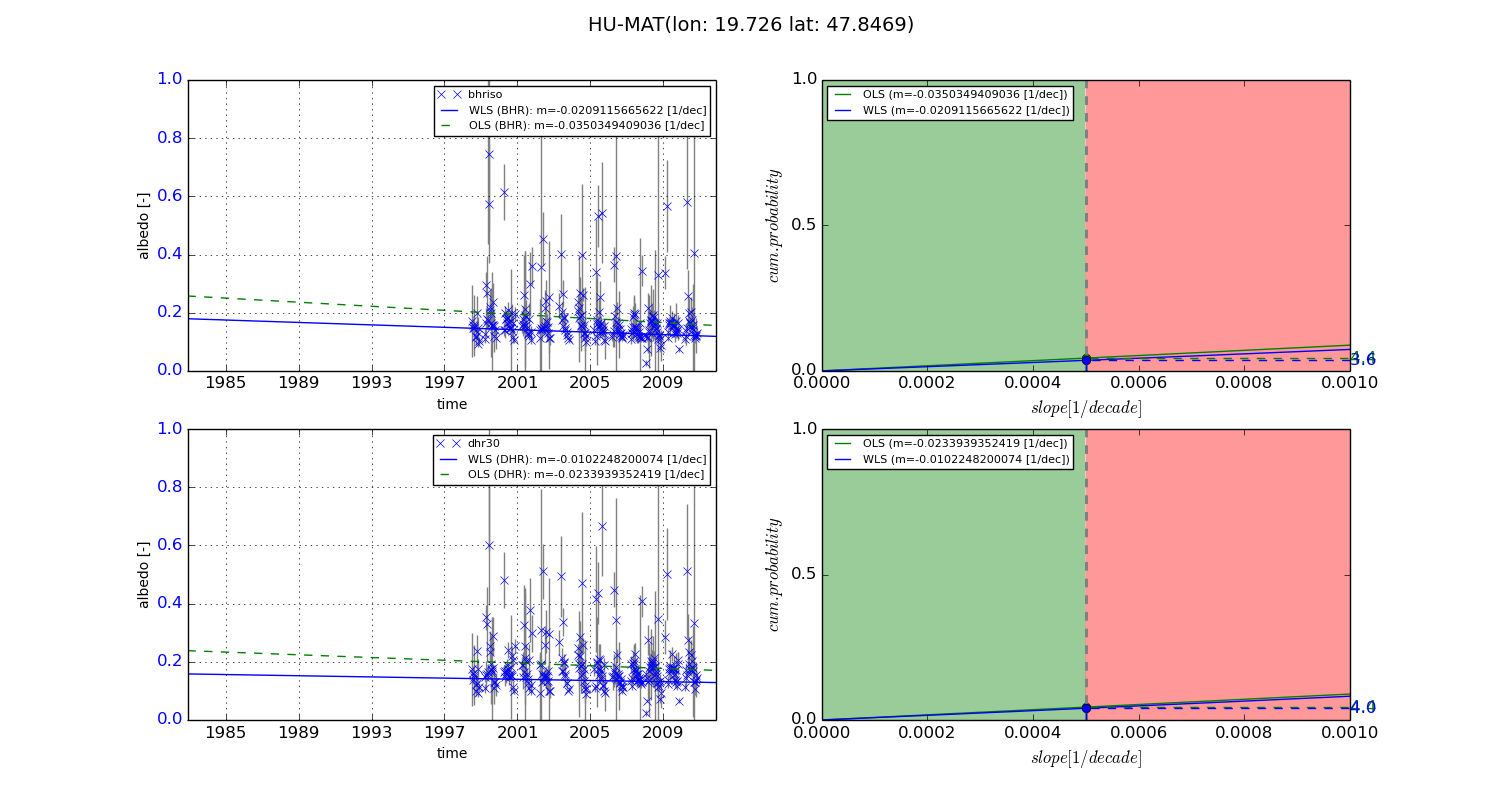
Temporal stability analysis

+000 deg (BHR)


BHR statistics

Temporal stability [1/decade]:


abs

rel


Weighted least square:

-0.00747280614489


Ordinary least square:

-0.00411349786902


Probabilities that GCOS criteria is met:

Weighted least square:

2.9 %

Ordinary least square:

4.7 %


DHR statistics

Temporal stability [1/decade]:


abs

rel


Weighted least square:

-0.00319817515197


Ordinary least square:

-0.00590320079173


Probabilities that GCOS criteria is met:

Weighted least square:

5.1 %

Ordinary least square:

4.2 %


+057/+063 deg (BHR)


BHR statistics

Temporal stability [1/decade]:


abs

rel


Weighted least square:

-0.0209115665622


Ordinary least square:

-0.0350349409036


Probabilities that GCOS criteria is met:

Weighted least square:

3.6 %

Ordinary least square:

4.4 %


DHR statistics

Temporal stability [1/decade]:


abs

rel


Weighted least square:

-0.0102248200074


Ordinary least square:

-0.0233939352419


Probabilities that GCOS criteria is met:

Weighted least square:

4.0 %

Ordinary least square:

4.4 %


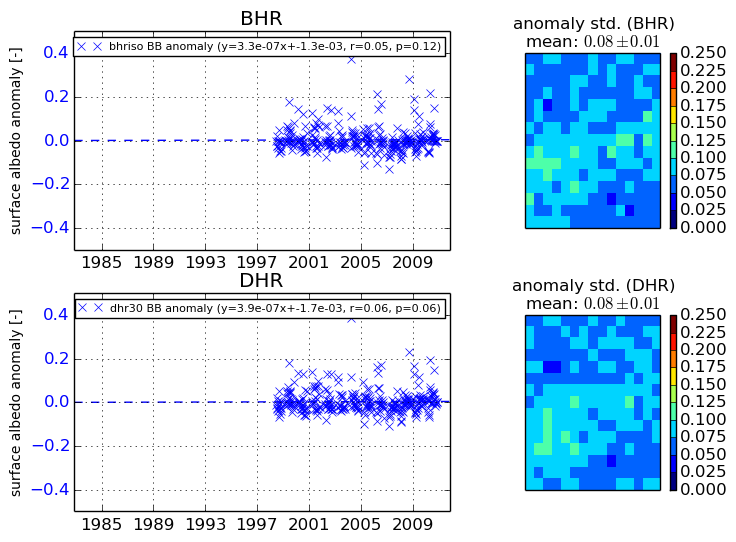
Temporal anomaly analyis

The variance of the temporal anomalies provides an additional measure about the stability of the signal AFTER removal of the mean seasonal cylce.
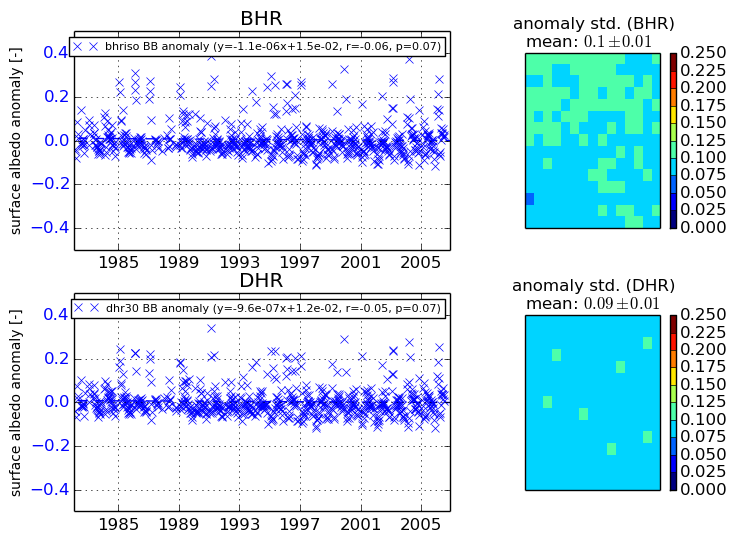
+000 deg


+057/+063 deg