HYYTIALA


Location

lon / lat [deg]: 24.2959 / 61.8464

Source network: AERONET


Geostationary surface albedo (GSA) data


“+000”


“+057/+063”


Landcover information (based on ESA CCI landcover data)


Landcover fractions @ 2km distance


Landcover fractions @ 20 km distance


Legend


Distance to open water bodies [km]:

0.59

Distance to urban areas [km]:

2.86


Radius: 1 km

Number of landcover classes:

3

Dominant landcover type:

70: Tree cover, needleleaved, evergreen, closed to open (>15%)

Fraction of dominant landcover type [%]:

82.0


Radius: 2 km

Number of landcover classes:

4

Dominant landcover type:

70: Tree cover, needleleaved, evergreen, closed to open (>15%)

Fraction of dominant landcover type [%]:

83.0


Radius: 5 km

Number of landcover classes:

4

Dominant landcover type:

70: Tree cover, needleleaved, evergreen, closed to open (>15%)

Fraction of dominant landcover type [%]:

91.0


Radius: 10 km

Number of landcover classes:

7

Dominant landcover type:

70: Tree cover, needleleaved, evergreen, closed to open (>15%)

Fraction of dominant landcover type [%]:

81.0


Radius: 20 km

Number of landcover classes:

7

Dominant landcover type:

70: Tree cover, needleleaved, evergreen, closed to open (>15%)

Fraction of dominant landcover type [%]:

72.0


Disturbances


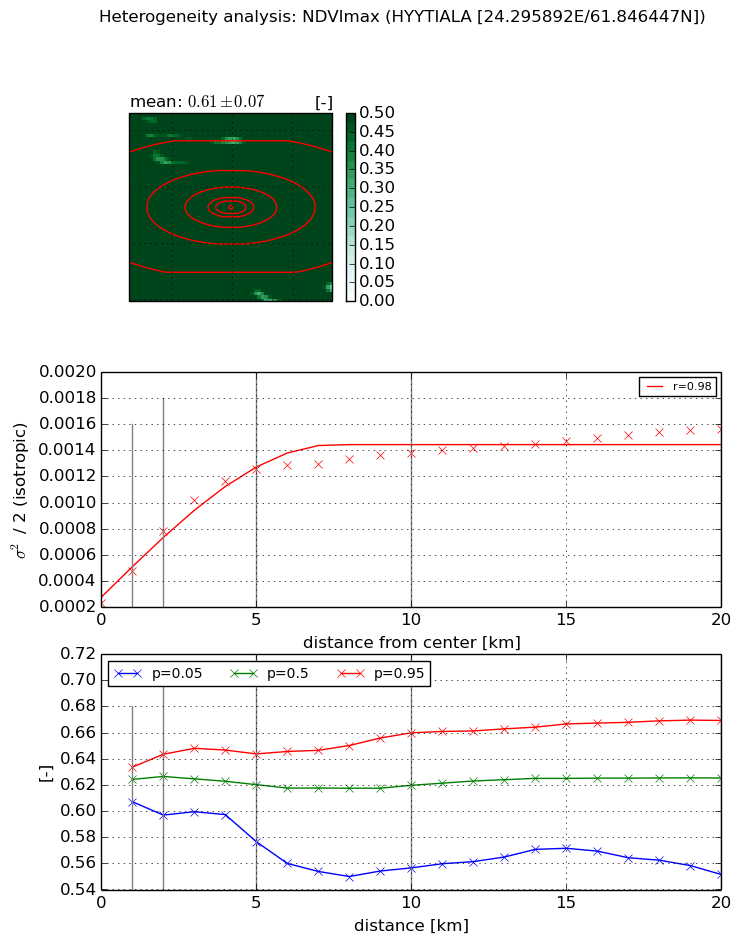
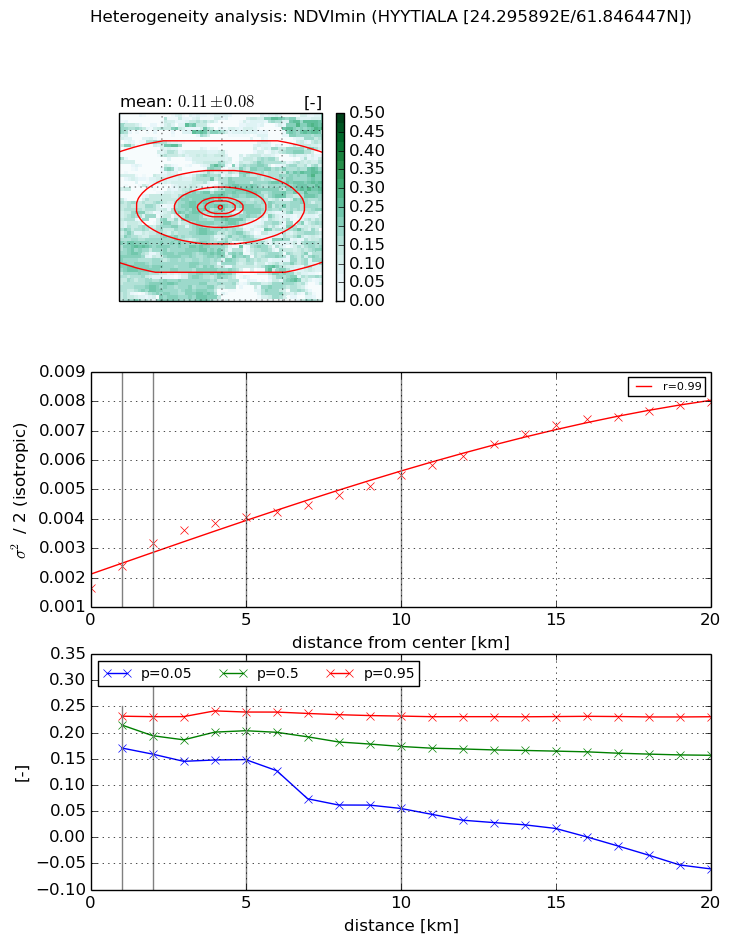
Heterogeneity analysis

The heterogeneity analysis provides information about the spatial and temporal heterogeneity of the site.

Topography


Roman et al. (2009) index


St

1.70814566904

Rcv

0.0199354649537

Rse

0.0

Rst

-0.19219866539

Rsv

1.54415636313


Height range @ 1km [m]

33

Height range @ 2km [m]

47

Height range @ 5km [m]

44

Height range @ 10km [m]

-999

Height range @ 20km [m]

-999


Variance slope @ 1 km

95

Variance slope @ 2 km

75

Variance slope @ 5 km

40

Variance slope @ 10 km

-999

Variance slope @ 20 km

-999


NDVI (max. NDVI composite)


Roman et al. (2009) index


St

2.02416414479

Rcv

0.311823389507

Rse

0.0

Rst

-0.245533741655

Rsv

0.924736110992


NDVI range @ 1km [-]

0.03

NDVI range @ 2km [-]

0.05

NDVI range @ 5km [-]

0.07

NDVI range @ 10km [-]

0.1

NDVI range @ 20km [-]

0.12


Variance slope @ 1 km

0.000241686358953

Variance slope @ 2 km

0.000275554235625

Variance slope @ 5 km

0.00021097716601

Variance slope @ 10 km

0.000105388716834

Variance slope @ 20 km

4.79035960143e-05


NDVI (min. NDVI composite)I


Roman et al. (2009) index


St

nan

Rcv

nan

Rse

nan

Rst

nan

Rsv

nan


NDVI range @ 1km [-]

0.06

NDVI range @ 2km [-]

0.07

NDVI range @ 5km [-]

0.09

NDVI range @ 10km [-]

0.18

NDVI range @ 20km [-]

0.29


NDVI slope @ 1 km

0.00073521920826

NDVI slope @ 2 km

0.000758707537598

NDVI slope @ 5 km

0.000484174172709

NDVI slope @ 10 km

0.000338430164976

NDVI slope @ 20 km

0.000301769021214


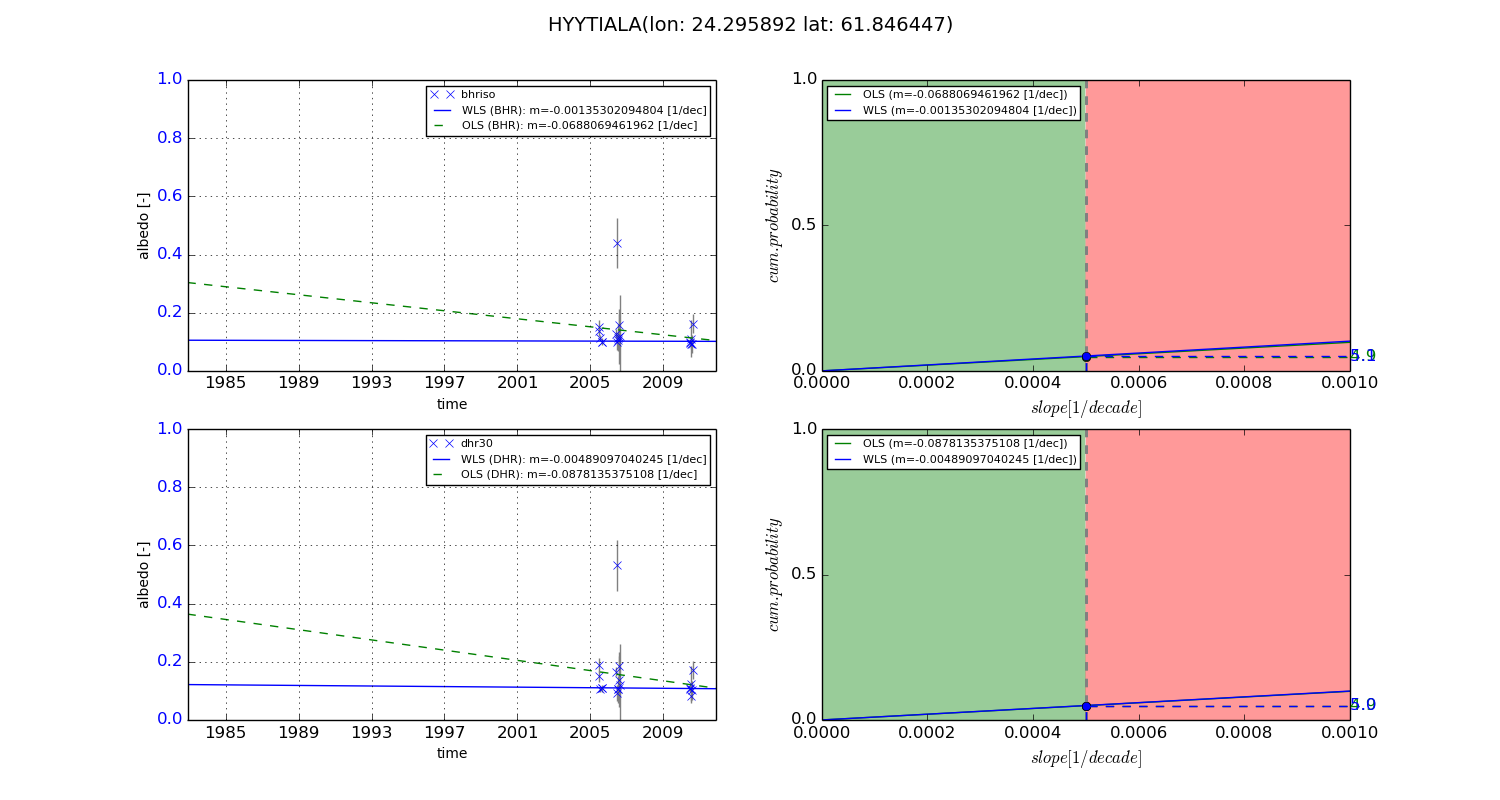
Temporal stability analysis

+000 deg (BHR)


BHR statistics

Temporal stability [1/decade]:


abs

rel


Weighted least square:

-99999.0


Ordinary least square:

-99999.0


Probabilities that GCOS criteria is met:

Weighted least square:

-99999.0 %

Ordinary least square:

-99999.0 %


DHR statistics

Temporal stability [1/decade]:


abs

rel


Weighted least square:

-99999.0


Ordinary least square:

-99999.0


Probabilities that GCOS criteria is met:

Weighted least square:

-99999.0 %

Ordinary least square:

-99999.0 %


+057/+063 deg (BHR)


BHR statistics

Temporal stability [1/decade]:


abs

rel


Weighted least square:

-0.00135302094804


Ordinary least square:

-0.0688069461962


Probabilities that GCOS criteria is met:

Weighted least square:

5.1 %

Ordinary least square:

4.9 %


DHR statistics

Temporal stability [1/decade]:


abs

rel


Weighted least square:

-0.00489097040245


Ordinary least square:

-0.0878135375108


Probabilities that GCOS criteria is met:

Weighted least square:

5.0 %

Ordinary least square:

4.9 %


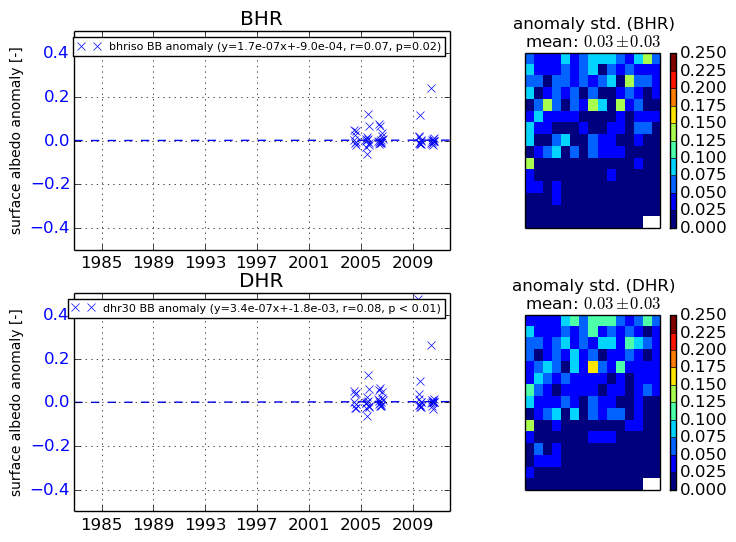
Temporal anomaly analyis

The variance of the temporal anomalies provides an additional measure about the stability of the signal AFTER removal of the mean seasonal cylce.

+000 deg


+057/+063 deg