IASBS


Location

lon / lat [deg]: 48.5071 / 36.7052

Source network: AERONET


Geostationary surface albedo (GSA) data


“+000”


“+057/+063”


Landcover information (based on ESA CCI landcover data)


Landcover fractions @ 2km distance


Landcover fractions @ 20 km distance


Legend


Distance to open water bodies [km]:

8.96

Distance to urban areas [km]:

0.89


Radius: 1 km

Number of landcover classes:

3

Dominant landcover type:

150: Sparse vegetation (tree, shrub, herbaceous cover) (<15%)

Fraction of dominant landcover type [%]:

78.0


Radius: 2 km

Number of landcover classes:

3

Dominant landcover type:

150: Sparse vegetation (tree, shrub, herbaceous cover) (<15%)

Fraction of dominant landcover type [%]:

61.0


Radius: 5 km

Number of landcover classes:

4

Dominant landcover type:

150: Sparse vegetation (tree, shrub, herbaceous cover) (<15%)

Fraction of dominant landcover type [%]:

60.0


Radius: 10 km

Number of landcover classes:

5

Dominant landcover type:

150: Sparse vegetation (tree, shrub, herbaceous cover) (<15%)

Fraction of dominant landcover type [%]:

73.0


Radius: 20 km

Number of landcover classes:

4

Dominant landcover type:

150: Sparse vegetation (tree, shrub, herbaceous cover) (<15%)

Fraction of dominant landcover type [%]:

78.0


Disturbances


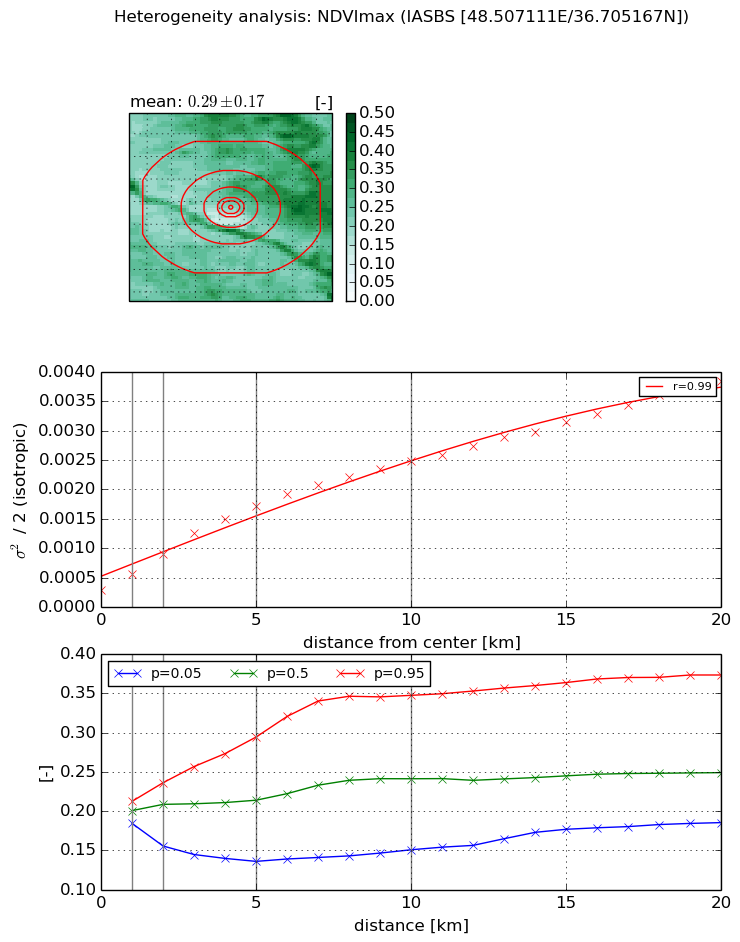
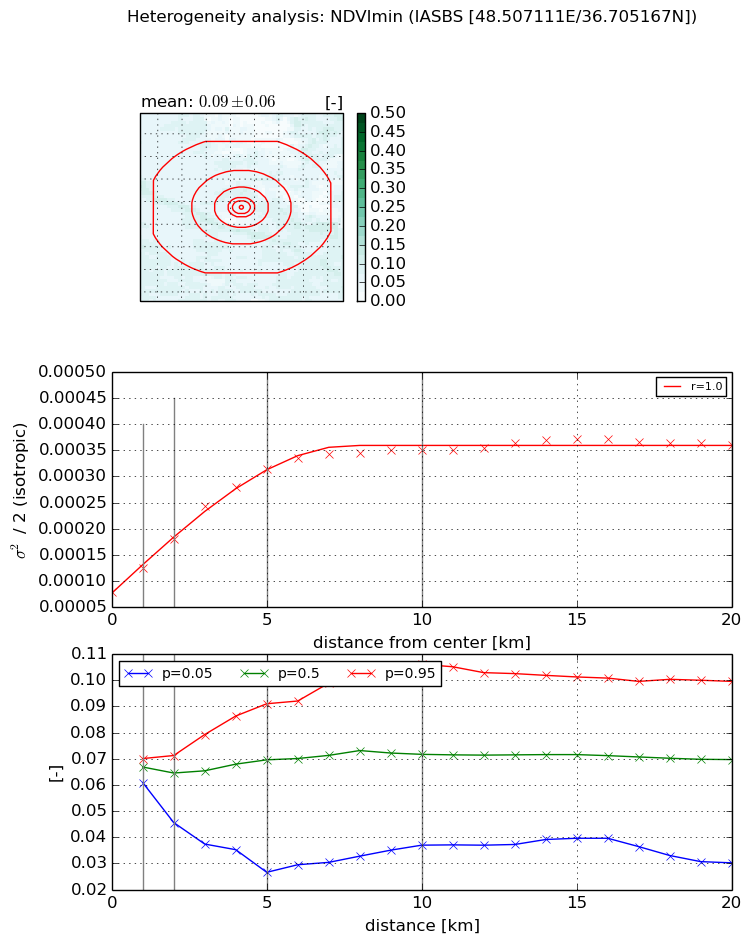
Heterogeneity analysis

The heterogeneity analysis provides information about the spatial and temporal heterogeneity of the site.

Topography


Roman et al. (2009) index


St

0.012207120687

Rcv

0.504576416576

Rse

0.0

Rst

3.12760300118e-05

Rsv

245.253591716


Height range @ 1km [m]

77

Height range @ 2km [m]

199

Height range @ 5km [m]

508

Height range @ 10km [m]

-999

Height range @ 20km [m]

-999


Variance slope @ 1 km

2018

Variance slope @ 2 km

2572

Variance slope @ 5 km

5139

Variance slope @ 10 km

-999

Variance slope @ 20 km

-999


NDVI (max. NDVI composite)


Roman et al. (2009) index


St

1.85779174411

Rcv

0.409267403284

Rse

0.0

Rst

-0.205552998017

Rsv

-0.99999999475


NDVI range @ 1km [-]

0.03

NDVI range @ 2km [-]

0.08

NDVI range @ 5km [-]

0.16

NDVI range @ 10km [-]

0.2

NDVI range @ 20km [-]

0.19


Variance slope @ 1 km

0.000274558894325

Variance slope @ 2 km

0.000304290047903

Variance slope @ 5 km

0.000294574653175

Variance slope @ 10 km

0.000218392703506

Variance slope @ 20 km

0.000164743400067


NDVI (min. NDVI composite)I


Roman et al. (2009) index


St

1.86045407588

Rcv

0.4967514867

Rse

0.0

Rst

-0.115758512437

Rsv

-0.999999569844


NDVI range @ 1km [-]

0.01

NDVI range @ 2km [-]

0.03

NDVI range @ 5km [-]

0.06

NDVI range @ 10km [-]

0.07

NDVI range @ 20km [-]

0.07


NDVI slope @ 1 km

4.76058937177e-05

NDVI slope @ 2 km

5.14562267932e-05

NDVI slope @ 5 km

4.87450272832e-05

NDVI slope @ 10 km

2.73273451078e-05

NDVI slope @ 20 km

1.08505432715e-05


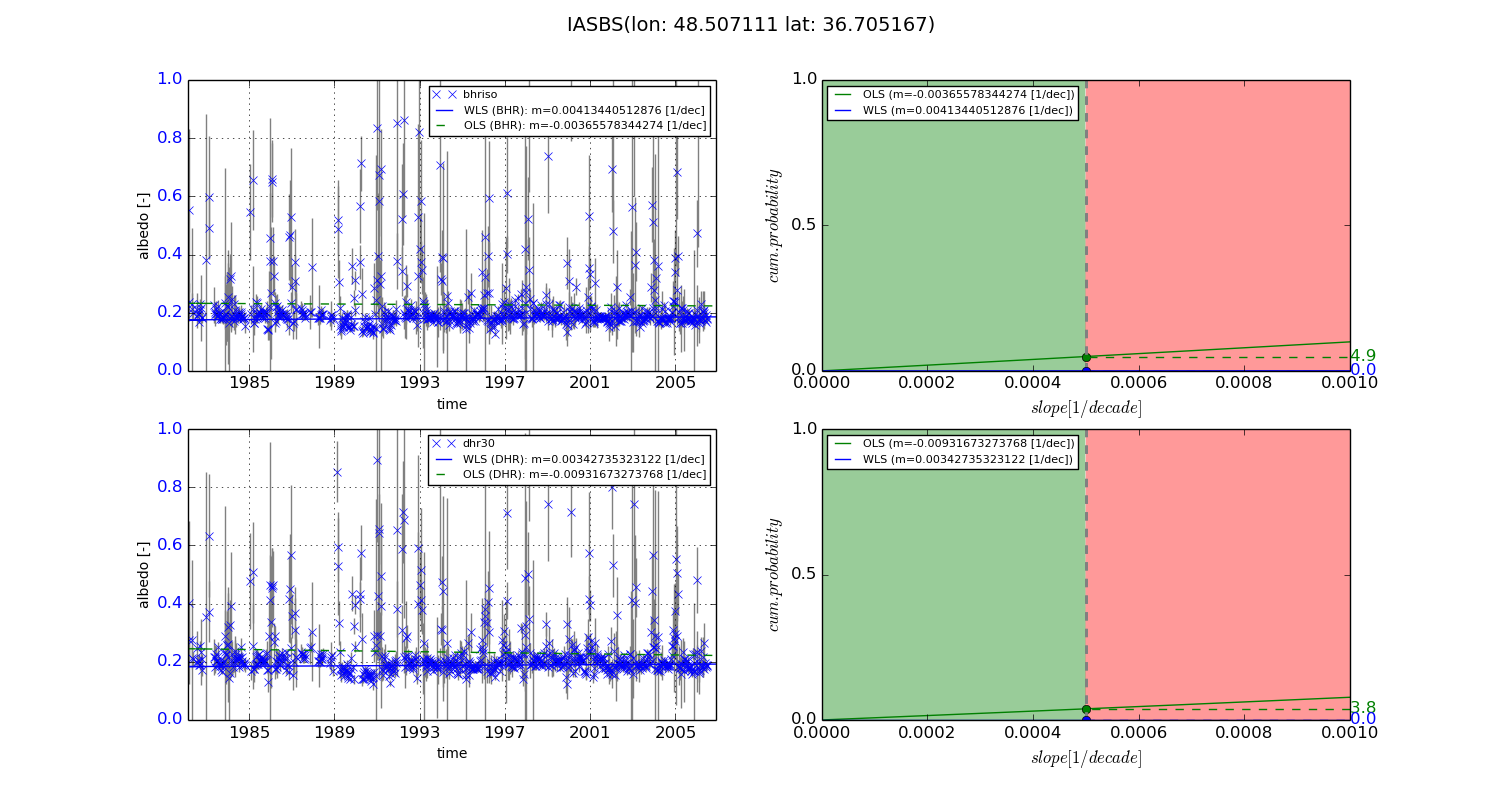
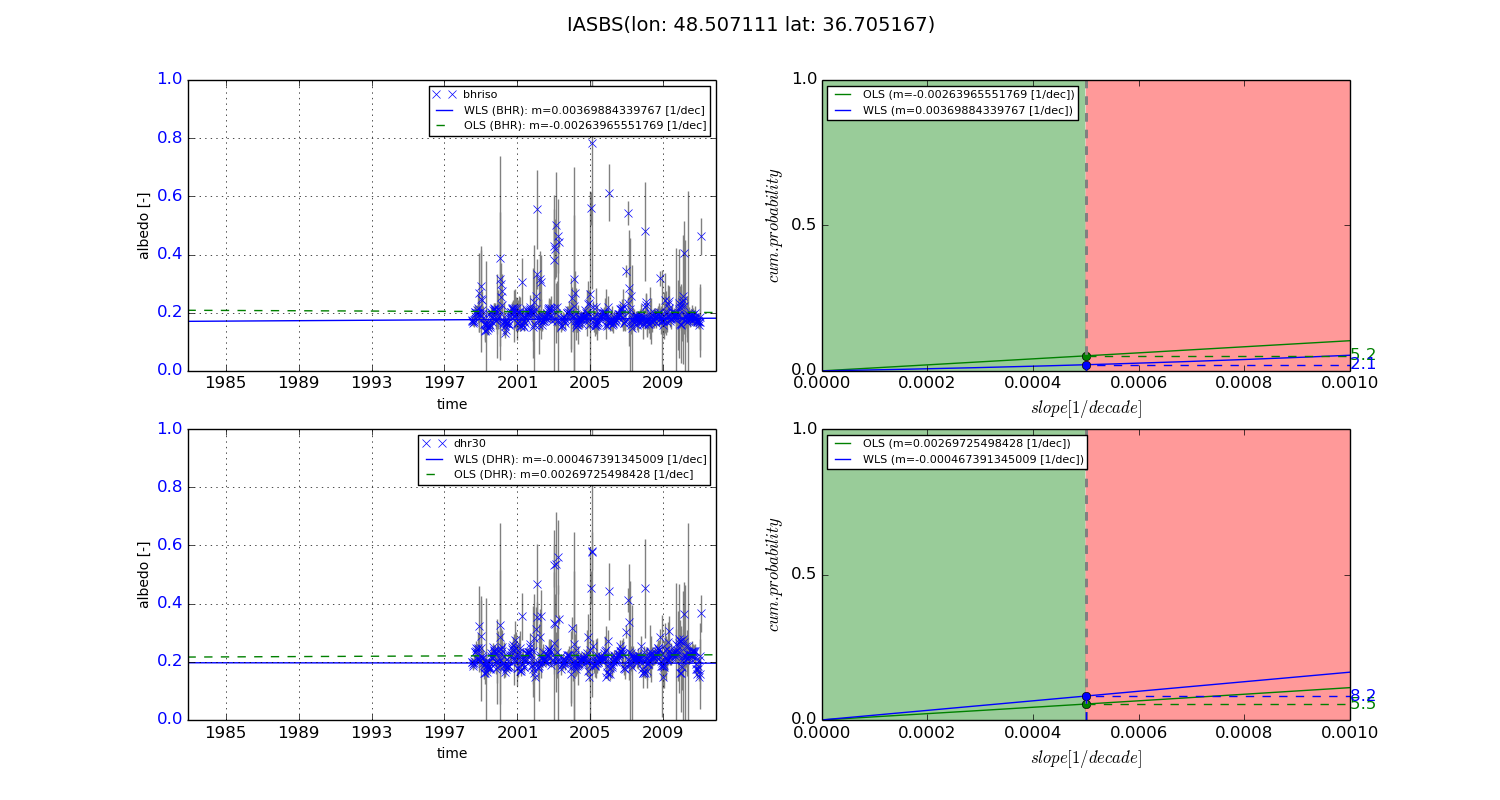
Temporal stability analysis

+000 deg (BHR)


BHR statistics

Temporal stability [1/decade]:


abs

rel


Weighted least square:

0.00413440512876


Ordinary least square:

-0.00365578344274


Probabilities that GCOS criteria is met:

Weighted least square:

0.0 %

Ordinary least square:

4.9 %


DHR statistics

Temporal stability [1/decade]:


abs

rel


Weighted least square:

0.00342735323122


Ordinary least square:

-0.00931673273768


Probabilities that GCOS criteria is met:

Weighted least square:

0.0 %

Ordinary least square:

3.8 %


+057/+063 deg (BHR)


BHR statistics

Temporal stability [1/decade]:


abs

rel


Weighted least square:

0.00369884339767


Ordinary least square:

-0.00263965551769


Probabilities that GCOS criteria is met:

Weighted least square:

2.1 %

Ordinary least square:

5.2 %


DHR statistics

Temporal stability [1/decade]:


abs

rel


Weighted least square:

-0.000467391345009


Ordinary least square:

0.00269725498428


Probabilities that GCOS criteria is met:

Weighted least square:

8.2 %

Ordinary least square:

5.5 %


Temporal anomaly analyis

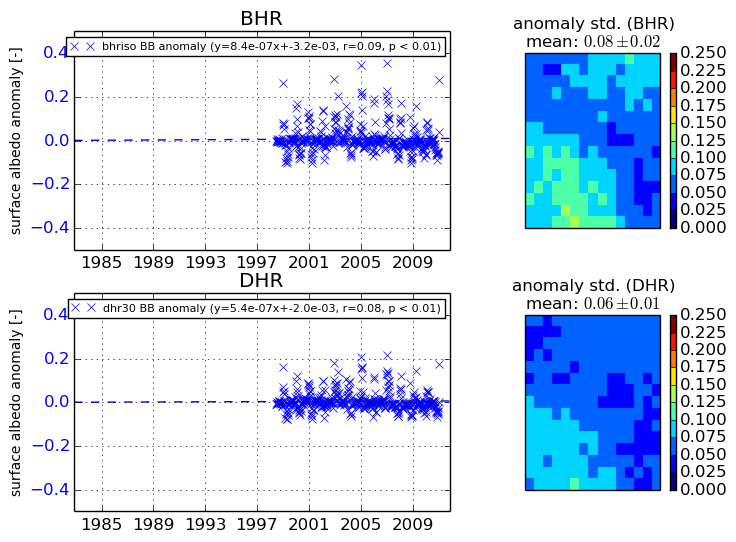
The variance of the temporal anomalies provides an additional measure about the stability of the signal AFTER removal of the mean seasonal cylce.
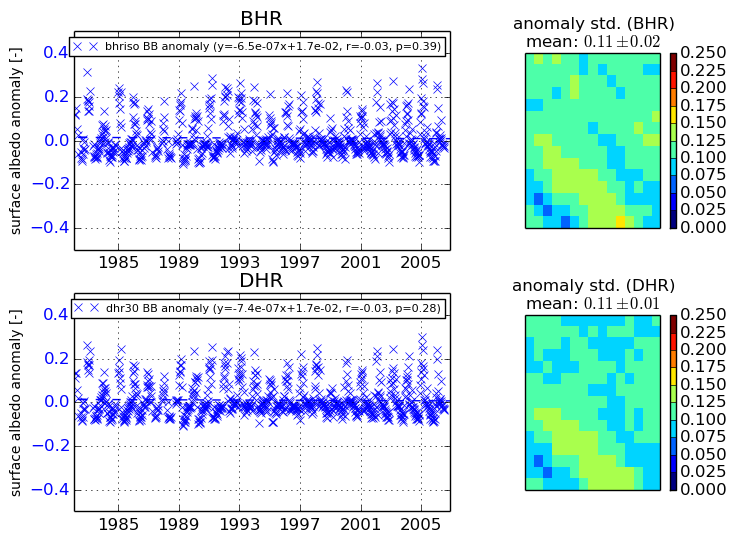
+000 deg


+057/+063 deg