IASI_LOASL


Location

lon / lat [deg]: 27.5556 / 47.1931

Source network: AERONET


Geostationary surface albedo (GSA) data


“+000”


“+057/+063”


Landcover information (based on ESA CCI landcover data)


Landcover fractions @ 2km distance


Landcover fractions @ 20 km distance


Legend


Distance to open water bodies [km]:

2.3

Distance to urban areas [km]:

0.1


Radius: 1 km

Number of landcover classes:

3

Dominant landcover type:

190: urban areas

Fraction of dominant landcover type [%]:

83.0


Radius: 2 km

Number of landcover classes:

4

Dominant landcover type:

190: urban areas

Fraction of dominant landcover type [%]:

57.0


Radius: 5 km

Number of landcover classes:

5

Dominant landcover type:

190: urban areas

Fraction of dominant landcover type [%]:

48.0


Radius: 10 km

Number of landcover classes:

5

Dominant landcover type:

10: cropland, rainfed

Fraction of dominant landcover type [%]:

62.0


Radius: 20 km

Number of landcover classes:

5

Dominant landcover type:

10: cropland, rainfed

Fraction of dominant landcover type [%]:

67.0


Disturbances


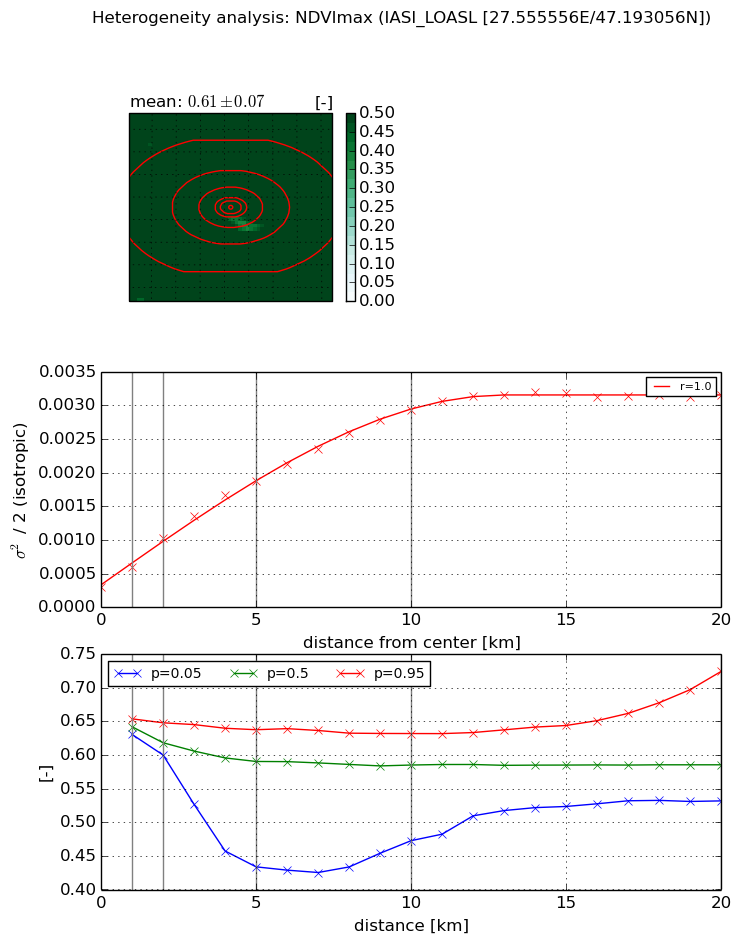
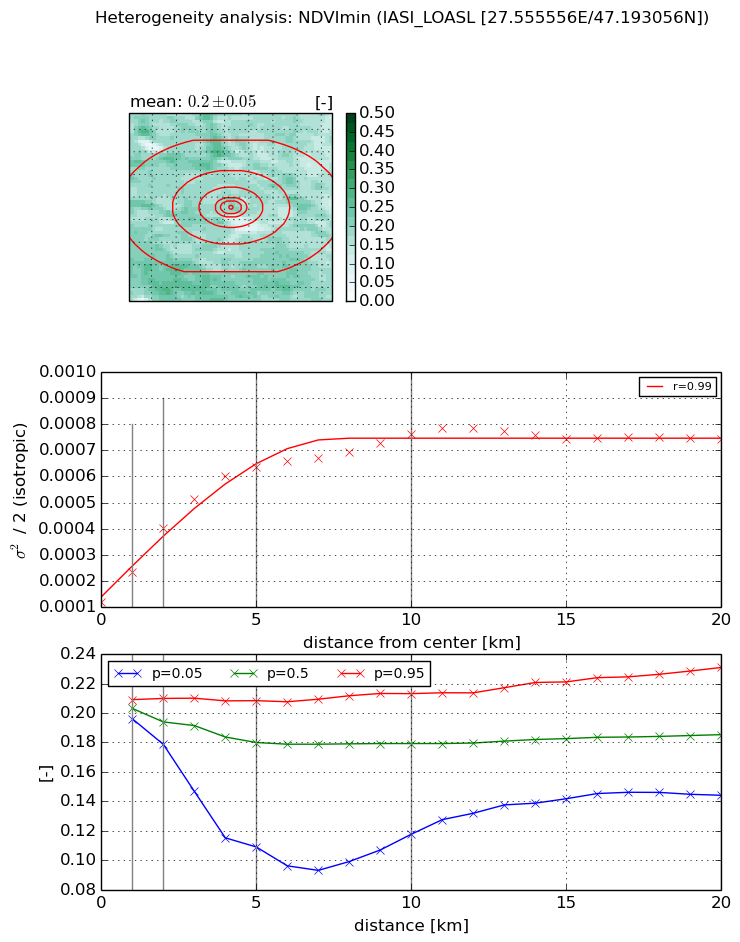
Heterogeneity analysis

The heterogeneity analysis provides information about the spatial and temporal heterogeneity of the site.

Topography


Roman et al. (2009) index


St

3.05707862684

Rcv

0.0727655564552

Rse

0.0

Rst

0.393917533482

Rsv

-0.514645938915


Height range @ 1km [m]

100

Height range @ 2km [m]

114

Height range @ 5km [m]

130

Height range @ 10km [m]

-999

Height range @ 20km [m]

-999


Variance slope @ 1 km

1011

Variance slope @ 2 km

801

Variance slope @ 5 km

327

Variance slope @ 10 km

-999

Variance slope @ 20 km

-999


NDVI (max. NDVI composite)


Roman et al. (2009) index


St

2.48008619977

Rcv

0.707122940879

Rse

0.0

Rst

-0.0677134126399

Rsv

0.434799021363


NDVI range @ 1km [-]

0.02

NDVI range @ 2km [-]

0.05

NDVI range @ 5km [-]

0.2

NDVI range @ 10km [-]

0.16

NDVI range @ 20km [-]

0.19


Variance slope @ 1 km

0.000299081688176

Variance slope @ 2 km

0.0003640999327

Variance slope @ 5 km

0.000326971587881

Variance slope @ 10 km

0.00026450205451

Variance slope @ 20 km

0.000135516334881


NDVI (min. NDVI composite)I


Roman et al. (2009) index


St

4.63379914353

Rcv

0.481171904934

Rse

0.0

Rst

0.0454459560168

Rsv

-0.120799065652


NDVI range @ 1km [-]

0.01

NDVI range @ 2km [-]

0.03

NDVI range @ 5km [-]

0.1

NDVI range @ 10km [-]

0.1

NDVI range @ 20km [-]

0.09


NDVI slope @ 1 km

0.000116104724025

NDVI slope @ 2 km

0.000140897267484

NDVI slope @ 5 km

0.000108835898087

NDVI slope @ 10 km

5.84921361036e-05

NDVI slope @ 20 km

2.29327485261e-05


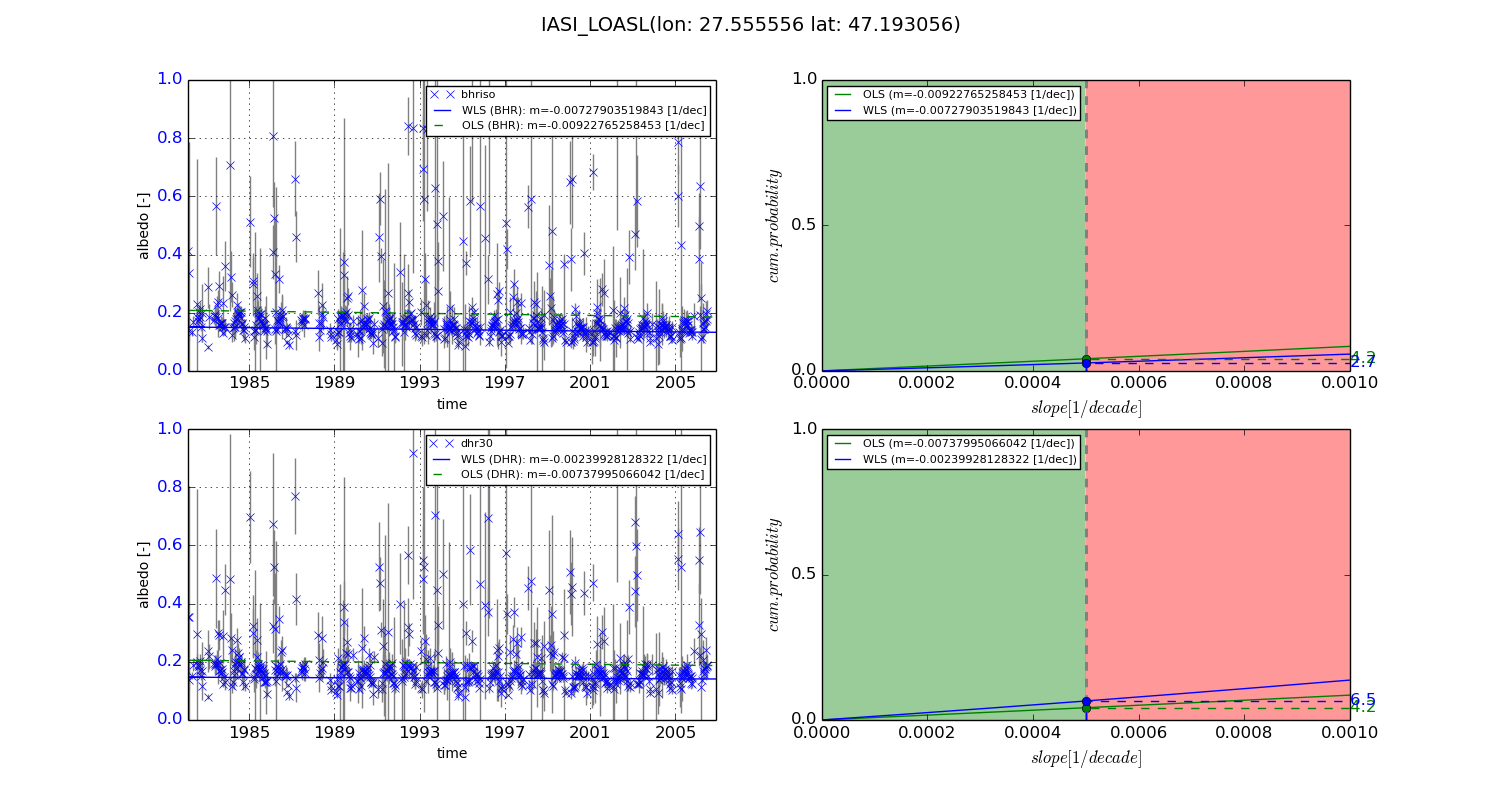
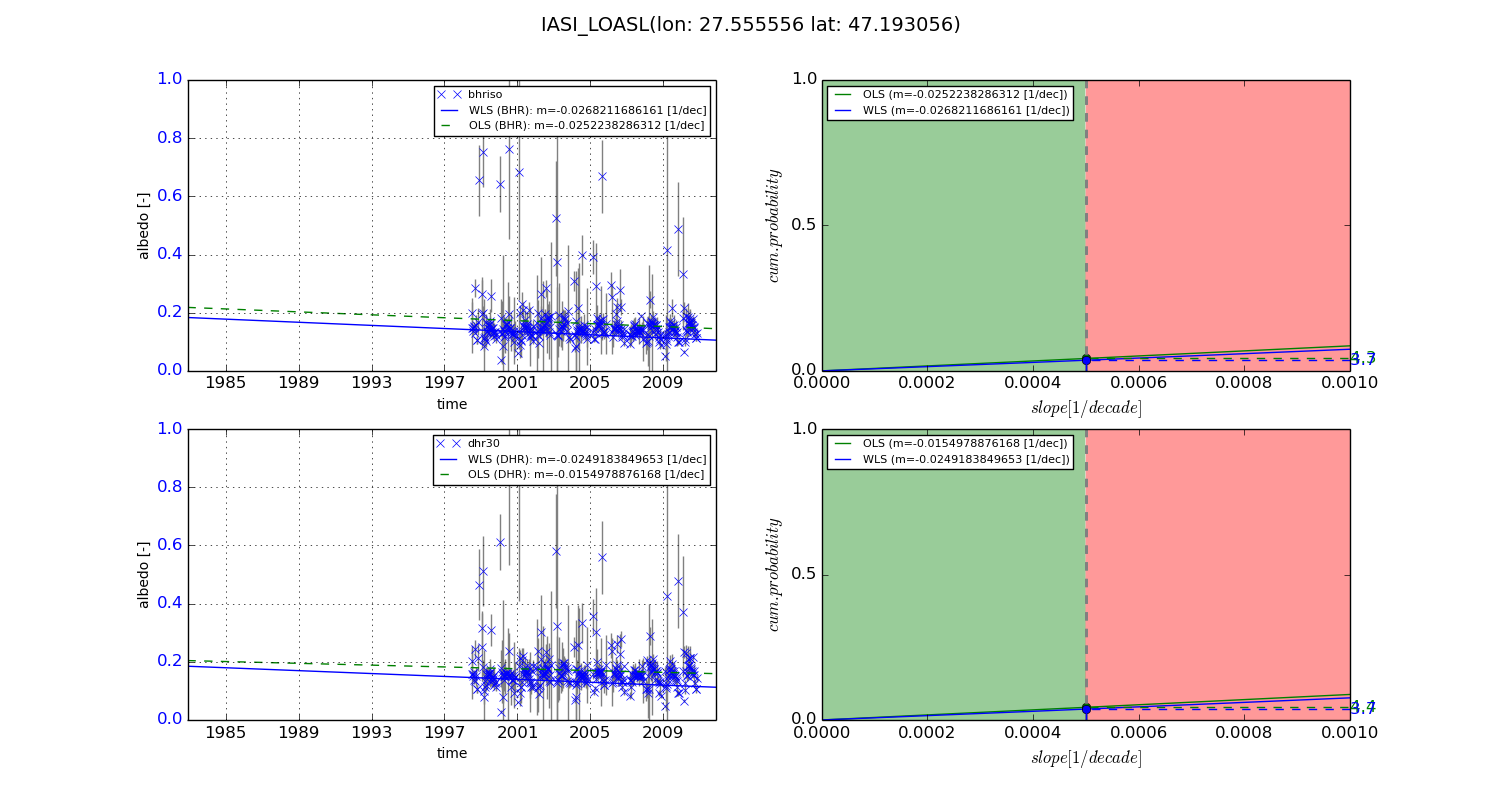
Temporal stability analysis

+000 deg (BHR)


BHR statistics

Temporal stability [1/decade]:


abs

rel


Weighted least square:

-0.00727903519843


Ordinary least square:

-0.00922765258453


Probabilities that GCOS criteria is met:

Weighted least square:

2.7 %

Ordinary least square:

4.2 %


DHR statistics

Temporal stability [1/decade]:


abs

rel


Weighted least square:

-0.00239928128322


Ordinary least square:

-0.00737995066042


Probabilities that GCOS criteria is met:

Weighted least square:

6.5 %

Ordinary least square:

4.2 %


+057/+063 deg (BHR)


BHR statistics

Temporal stability [1/decade]:


abs

rel


Weighted least square:

-0.0268211686161


Ordinary least square:

-0.0252238286312


Probabilities that GCOS criteria is met:

Weighted least square:

3.7 %

Ordinary least square:

4.3 %


DHR statistics

Temporal stability [1/decade]:


abs

rel


Weighted least square:

-0.0249183849653


Ordinary least square:

-0.0154978876168


Probabilities that GCOS criteria is met:

Weighted least square:

3.7 %

Ordinary least square:

4.4 %


Temporal anomaly analyis

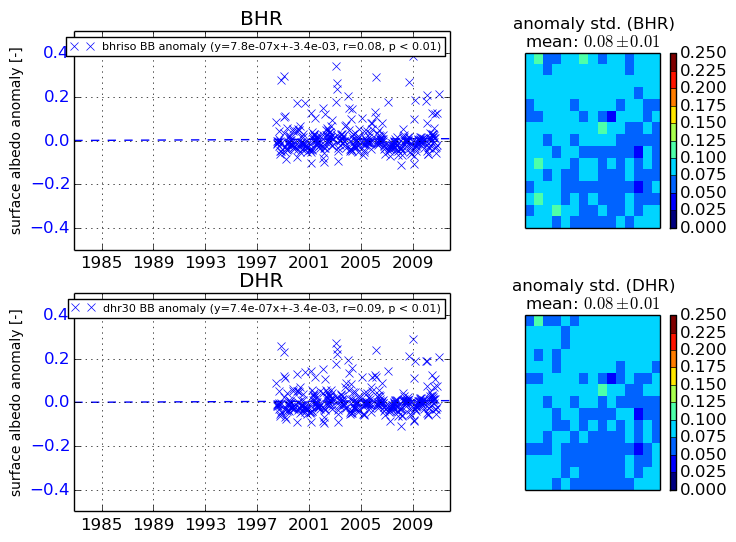
The variance of the temporal anomalies provides an additional measure about the stability of the signal AFTER removal of the mean seasonal cylce.
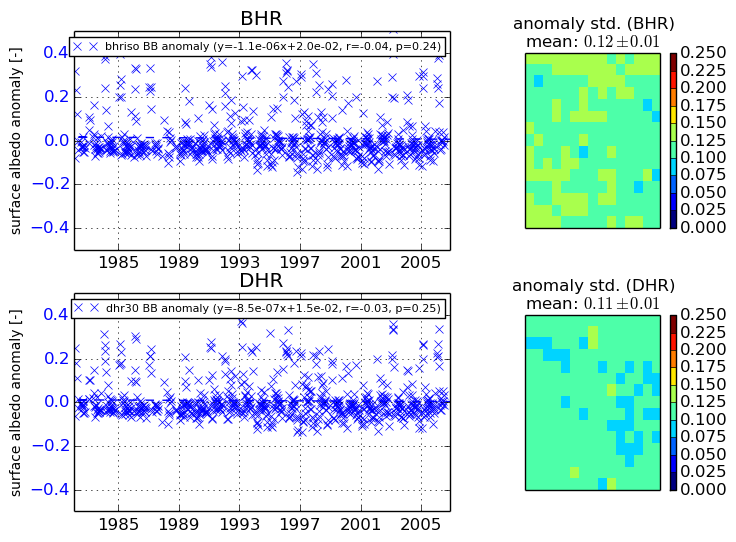
+000 deg


+057/+063 deg