ICIPE-MBITA


Location

lon / lat [deg]: 34.2 / -0.4167

Source network: AERONET


Geostationary surface albedo (GSA) data


“+000”


“+057/+063”


Landcover information (based on ESA CCI landcover data)


Landcover fractions @ 2km distance


Landcover fractions @ 20 km distance


Legend


Distance to open water bodies [km]:

0.22

Distance to urban areas [km]:

2.71


Radius: 1 km

Number of landcover classes:

1

Dominant landcover type:

210: water bodies

Fraction of dominant landcover type [%]:

100.0


Radius: 2 km

Number of landcover classes:

1

Dominant landcover type:

210: water bodies

Fraction of dominant landcover type [%]:

100.0


Radius: 5 km

Number of landcover classes:

5

Dominant landcover type:

210: water bodies

Fraction of dominant landcover type [%]:

83.0


Radius: 10 km

Number of landcover classes:

3

Dominant landcover type:

210: water bodies

Fraction of dominant landcover type [%]:

80.0


Radius: 20 km

Number of landcover classes:

3

Dominant landcover type:

210: water bodies

Fraction of dominant landcover type [%]:

71.0


Disturbances


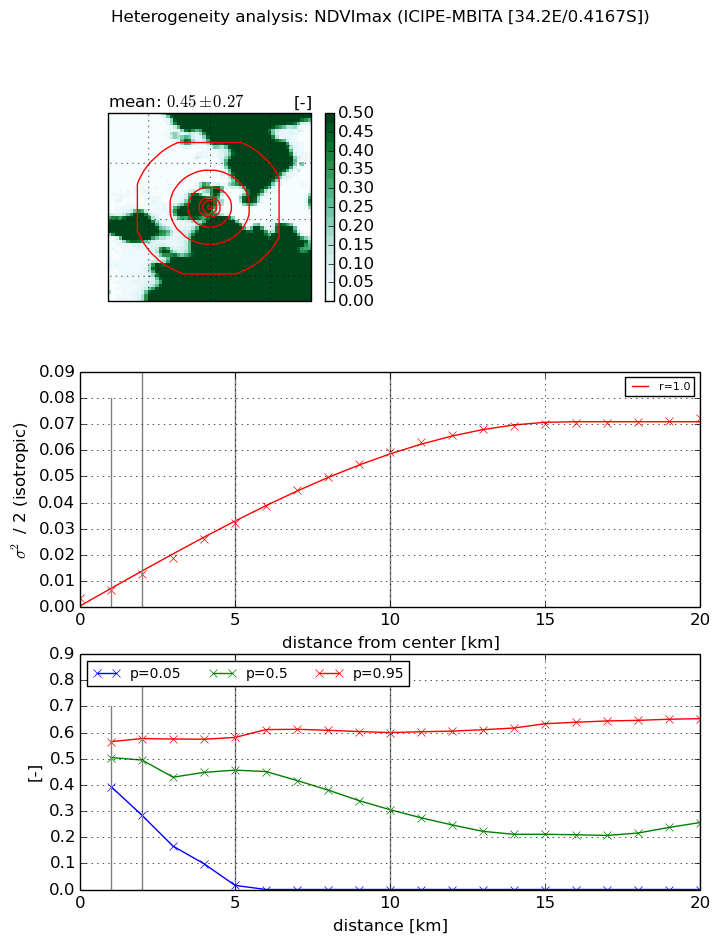
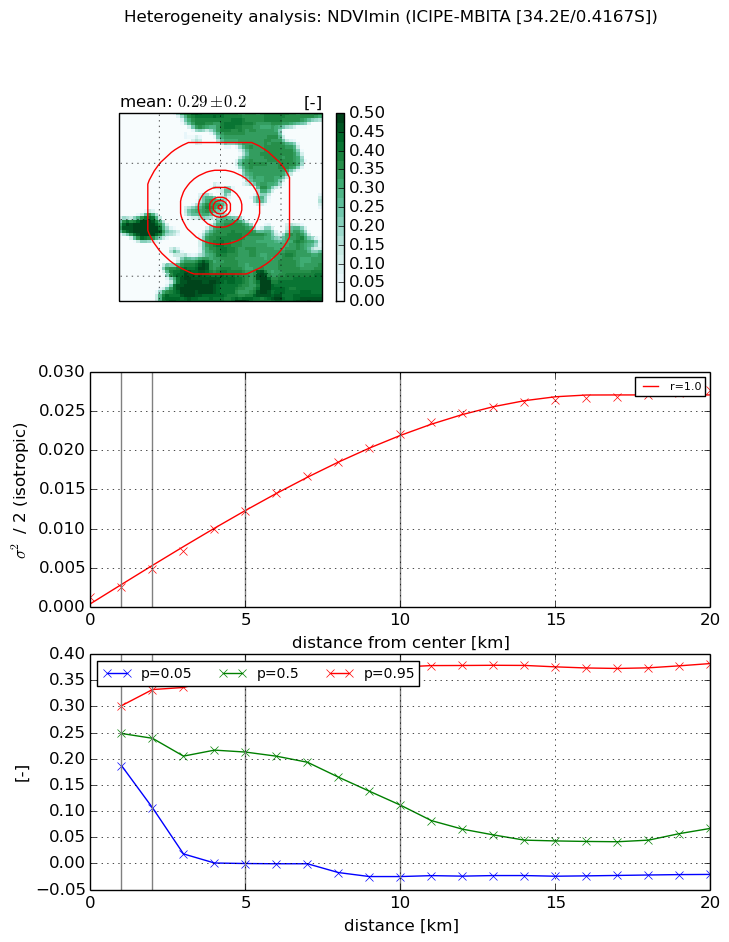
Heterogeneity analysis

The heterogeneity analysis provides information about the spatial and temporal heterogeneity of the site.

Topography


Roman et al. (2009) index


St

0.000400607820864

Rcv

0.229010627502

Rse

0.0

Rst

0.0656895595624

Rsv

7488.32595013


Height range @ 1km [m]

23

Height range @ 2km [m]

26

Height range @ 5km [m]

71

Height range @ 10km [m]

-999

Height range @ 20km [m]

-999


Variance slope @ 1 km

610

Variance slope @ 2 km

529

Variance slope @ 5 km

186

Variance slope @ 10 km

-999

Variance slope @ 20 km

-999


NDVI (max. NDVI composite)


Roman et al. (2009) index


St

2.34502818992

Rcv

0.445113769487

Rse

0.0

Rst

-0.273802208163

Rsv

0.560386340716


NDVI range @ 1km [-]

0.17

NDVI range @ 2km [-]

0.29

NDVI range @ 5km [-]

0.57

NDVI range @ 10km [-]

0.6

NDVI range @ 20km [-]

0.65


Variance slope @ 1 km

0.00327575523807

Variance slope @ 2 km

0.00462289118994

Variance slope @ 5 km

0.00597382039052

Variance slope @ 10 km

0.00588550710546

Variance slope @ 20 km

0.00361192921755


NDVI (min. NDVI composite)I


Roman et al. (2009) index


St

2.6719033406

Rcv

0.3481569839

Rse

0.0

Rst

-0.142114741666

Rsv

0.632523382479


NDVI range @ 1km [-]

0.11

NDVI range @ 2km [-]

0.23

NDVI range @ 5km [-]

0.35

NDVI range @ 10km [-]

0.4

NDVI range @ 20km [-]

0.4


NDVI slope @ 1 km

0.00125172642025

NDVI slope @ 2 km

0.00177220076438

NDVI slope @ 5 km

0.00226798424165

NDVI slope @ 10 km

0.00217297919562

NDVI slope @ 20 km

0.00137608851073


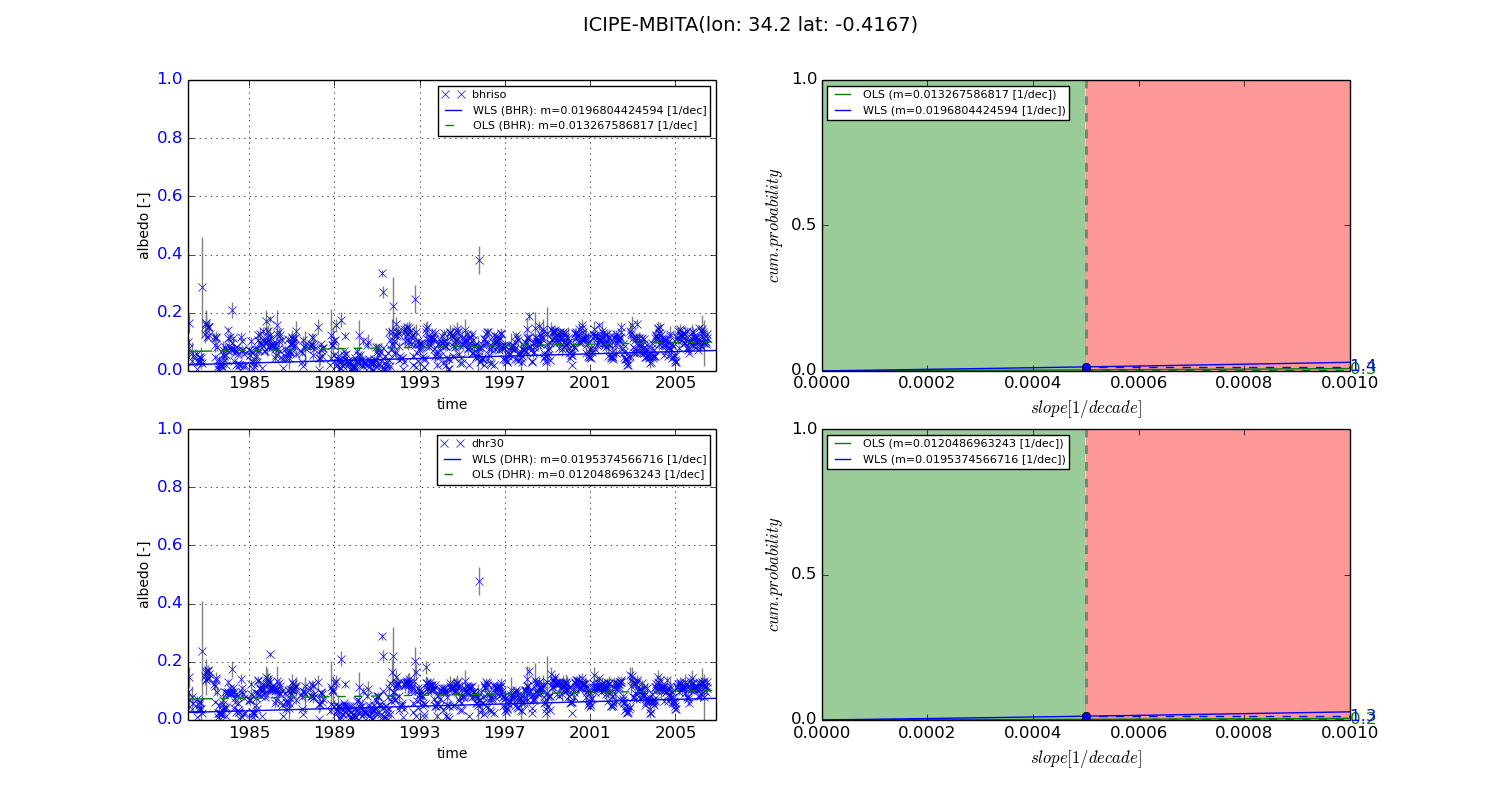
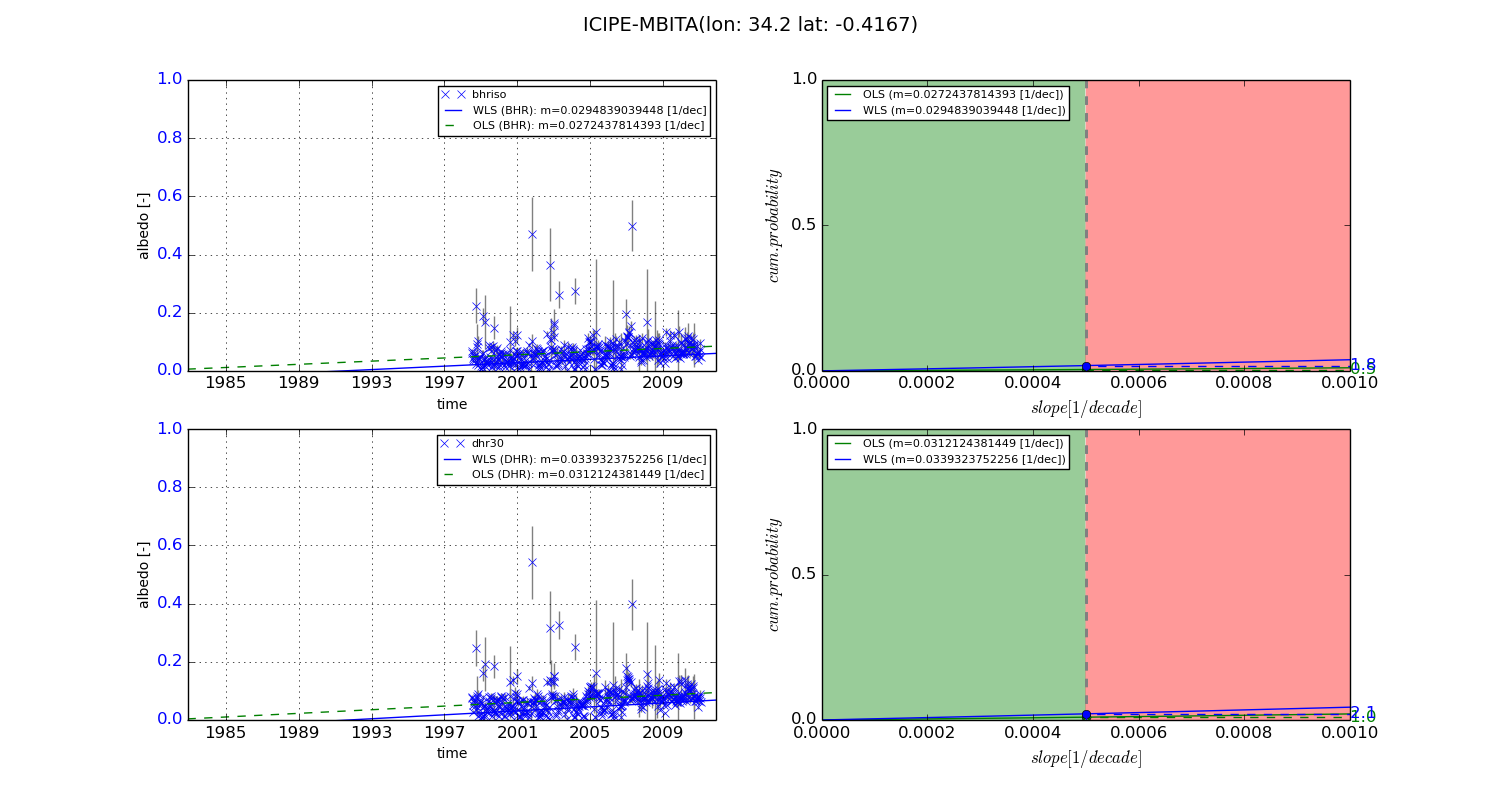
Temporal stability analysis

+000 deg (BHR)


BHR statistics

Temporal stability [1/decade]:


abs

rel


Weighted least square:

0.0196804424594


Ordinary least square:

0.013267586817


Probabilities that GCOS criteria is met:

Weighted least square:

1.4 %

Ordinary least square:

0.3 %


DHR statistics

Temporal stability [1/decade]:


abs

rel


Weighted least square:

0.0195374566716


Ordinary least square:

0.0120486963243


Probabilities that GCOS criteria is met:

Weighted least square:

1.3 %

Ordinary least square:

0.2 %


+057/+063 deg (BHR)


BHR statistics

Temporal stability [1/decade]:


abs

rel


Weighted least square:

0.0294839039448


Ordinary least square:

0.0272437814393


Probabilities that GCOS criteria is met:

Weighted least square:

1.8 %

Ordinary least square:

0.5 %


DHR statistics

Temporal stability [1/decade]:


abs

rel


Weighted least square:

0.0339323752256


Ordinary least square:

0.0312124381449


Probabilities that GCOS criteria is met:

Weighted least square:

2.1 %

Ordinary least square:

1.0 %


Temporal anomaly analyis

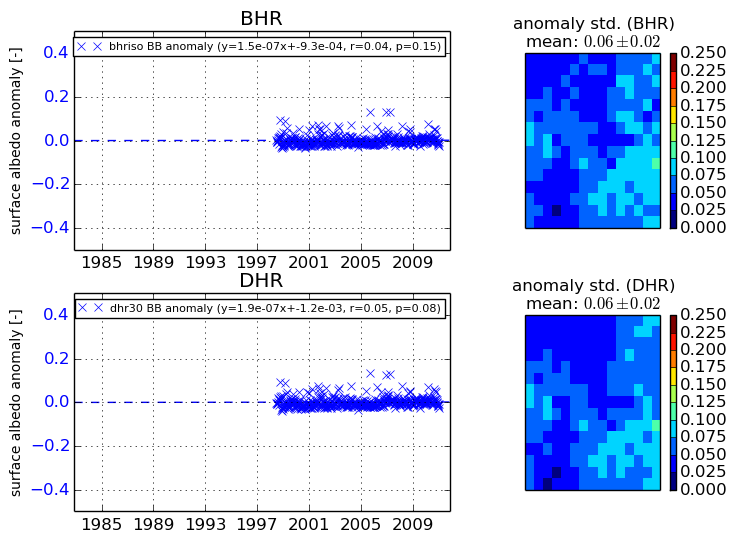
The variance of the temporal anomalies provides an additional measure about the stability of the signal AFTER removal of the mean seasonal cylce.
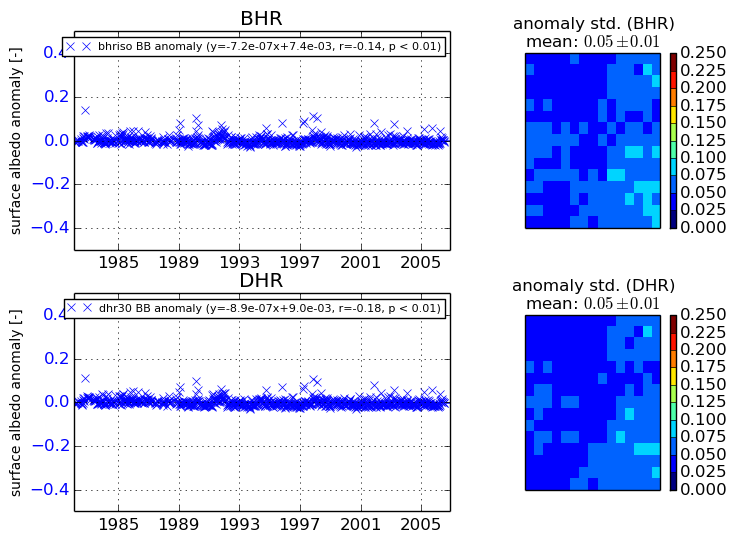
+000 deg


+057/+063 deg