ID-PAG


Location

lon / lat [deg]: 114.036 / 2.345

Source network: FLUXNET


Geostationary surface albedo (GSA) data


“+000”


“+057/+063”


Landcover information (based on ESA CCI landcover data)


Landcover fractions @ 2km distance


Landcover fractions @ 20 km distance


Legend


Distance to open water bodies [km]:

29.86

Distance to urban areas [km]:

46.88


Radius: 1 km

Number of landcover classes:

1

Dominant landcover type:

50: Tree cover, broadleaved, evergreen, closed to open (>15%)

Fraction of dominant landcover type [%]:

100.0


Radius: 2 km

Number of landcover classes:

1

Dominant landcover type:

50: Tree cover, broadleaved, evergreen, closed to open (>15%)

Fraction of dominant landcover type [%]:

100.0


Radius: 5 km

Number of landcover classes:

1

Dominant landcover type:

50: Tree cover, broadleaved, evergreen, closed to open (>15%)

Fraction of dominant landcover type [%]:

100.0


Radius: 10 km

Number of landcover classes:

2

Dominant landcover type:

50: Tree cover, broadleaved, evergreen, closed to open (>15%)

Fraction of dominant landcover type [%]:

98.0


Radius: 20 km

Number of landcover classes:

2

Dominant landcover type:

50: Tree cover, broadleaved, evergreen, closed to open (>15%)

Fraction of dominant landcover type [%]:

98.0


Disturbances


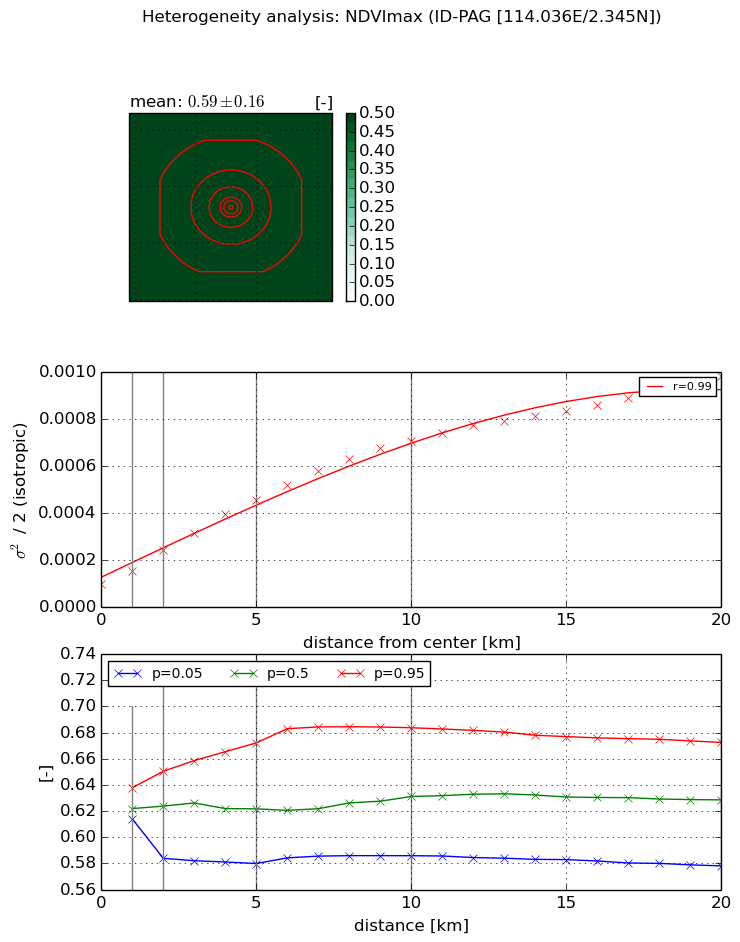
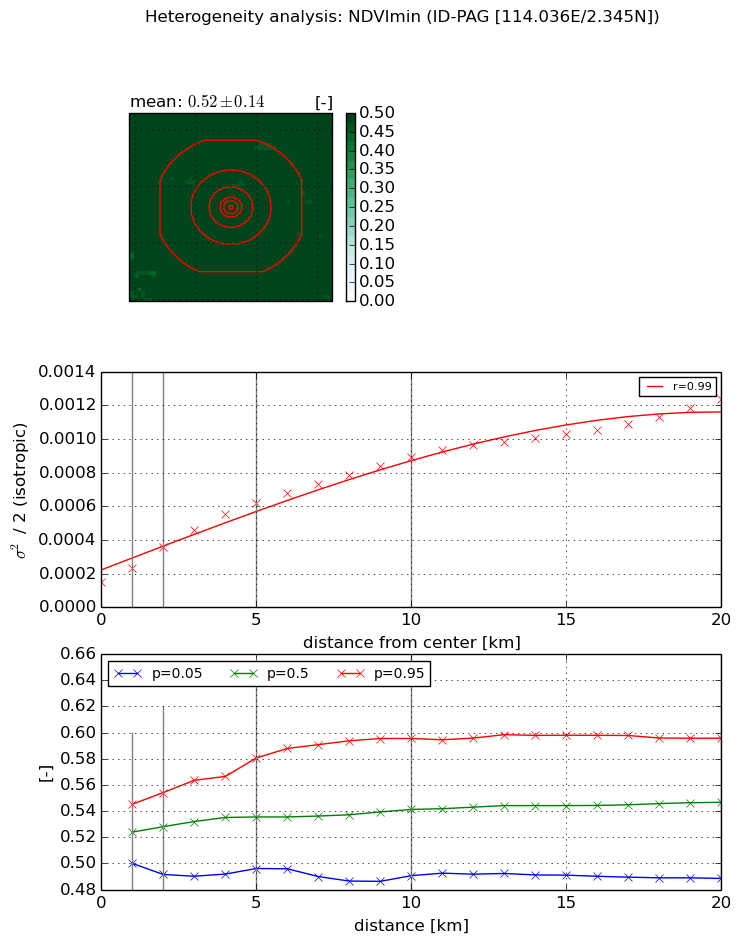
Heterogeneity analysis

The heterogeneity analysis provides information about the spatial and temporal heterogeneity of the site.

Topography


Roman et al. (2009) index


St

2.79325984238

Rcv

0.0734349315946

Rse

0.0

Rst

-0.00057900527074

Rsv

-1.0


Height range @ 1km [m]

405

Height range @ 2km [m]

542

Height range @ 5km [m]

587

Height range @ 10km [m]

-999

Height range @ 20km [m]

-999


Variance slope @ 1 km

7085

Variance slope @ 2 km

7148

Variance slope @ 5 km

6693

Variance slope @ 10 km

-999

Variance slope @ 20 km

-999


NDVI (max. NDVI composite)


Roman et al. (2009) index


St

2.97895692892

Rcv

0.226883947771

Rse

0.0

Rst

-5.41190322031e-08

Rsv

-0.780179903894


NDVI range @ 1km [-]

0.02

NDVI range @ 2km [-]

0.07

NDVI range @ 5km [-]

0.09

NDVI range @ 10km [-]

0.1

NDVI range @ 20km [-]

0.09


Variance slope @ 1 km

5.54777429983e-05

Variance slope @ 2 km

7.22189757775e-05

Variance slope @ 5 km

7.4162877884e-05

Variance slope @ 10 km

6.33761984869e-05

Variance slope @ 20 km

4.17855825241e-05


NDVI (min. NDVI composite)I


Roman et al. (2009) index


St

3.17829568169

Rcv

0.13376522603

Rse

0.0

Rst

-0.067316323698

Rsv

0.742820560224


NDVI range @ 1km [-]

0.05

NDVI range @ 2km [-]

0.06

NDVI range @ 5km [-]

0.08

NDVI range @ 10km [-]

0.1

NDVI range @ 20km [-]

0.11


NDVI slope @ 1 km

8.18034704238e-05

NDVI slope @ 2 km

0.000105041716737

NDVI slope @ 5 km

9.79015998193e-05

NDVI slope @ 10 km

7.38529313924e-05

NDVI slope @ 20 km

4.90565293899e-05


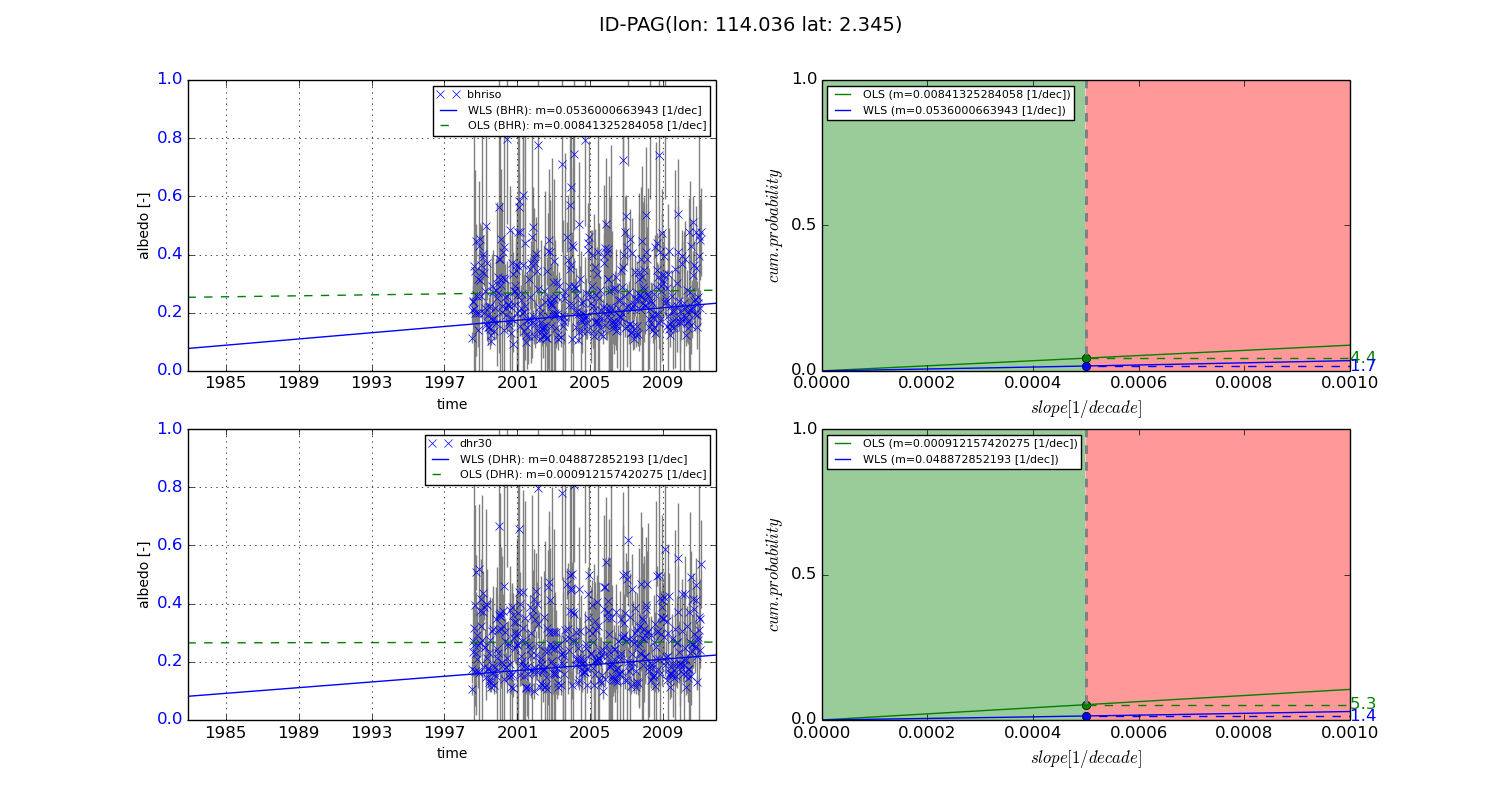
Temporal stability analysis

+000 deg (BHR)


BHR statistics

Temporal stability [1/decade]:


abs

rel


Weighted least square:

None


Ordinary least square:

None


Probabilities that GCOS criteria is met:

Weighted least square:

None %

Ordinary least square:

None %


DHR statistics

Temporal stability [1/decade]:


abs

rel


Weighted least square:

None


Ordinary least square:

None


Probabilities that GCOS criteria is met:

Weighted least square:

None %

Ordinary least square:

None %


+057/+063 deg (BHR)


BHR statistics

Temporal stability [1/decade]:


abs

rel


Weighted least square:

0.0536000663943


Ordinary least square:

0.00841325284058


Probabilities that GCOS criteria is met:

Weighted least square:

1.7 %

Ordinary least square:

4.4 %


DHR statistics

Temporal stability [1/decade]:


abs

rel


Weighted least square:

0.048872852193


Ordinary least square:

0.000912157420275


Probabilities that GCOS criteria is met:

Weighted least square:

1.4 %

Ordinary least square:

5.3 %


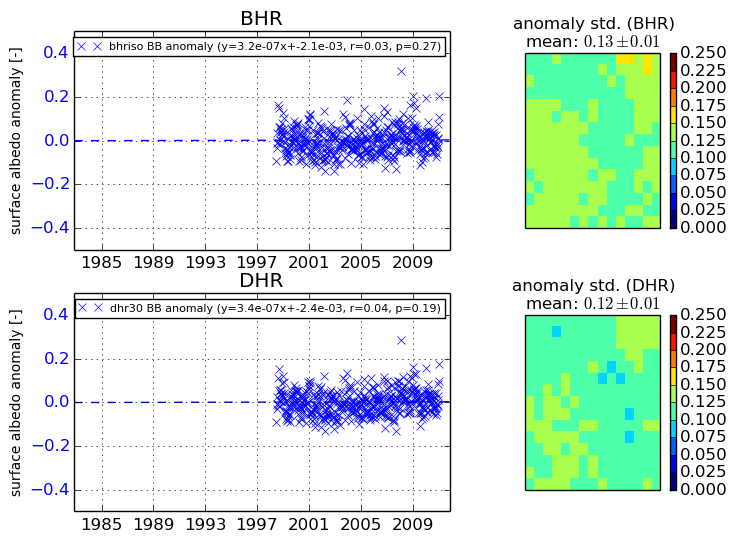
Temporal anomaly analyis

The variance of the temporal anomalies provides an additional measure about the stability of the signal AFTER removal of the mean seasonal cylce.

+000 deg


+057/+063 deg