IE-CA1


Location

lon / lat [deg]: -6.9181 / 52.8588

Source network: FLUXNET


Geostationary surface albedo (GSA) data


“+000”


“+057/+063”


Landcover information (based on ESA CCI landcover data)


Landcover fractions @ 2km distance


Landcover fractions @ 20 km distance


Legend


Distance to open water bodies [km]:

1.14

Distance to urban areas [km]:

0.9


Radius: 1 km

Number of landcover classes:

4

Dominant landcover type:

10: cropland, rainfed

Fraction of dominant landcover type [%]:

74.0


Radius: 2 km

Number of landcover classes:

5

Dominant landcover type:

10: cropland, rainfed

Fraction of dominant landcover type [%]:

34.0


Radius: 5 km

Number of landcover classes:

4

Dominant landcover type:

10: cropland, rainfed

Fraction of dominant landcover type [%]:

45.0


Radius: 10 km

Number of landcover classes:

4

Dominant landcover type:

10: cropland, rainfed

Fraction of dominant landcover type [%]:

42.0


Radius: 20 km

Number of landcover classes:

4

Dominant landcover type:

130: grassland

Fraction of dominant landcover type [%]:

55.0


Disturbances


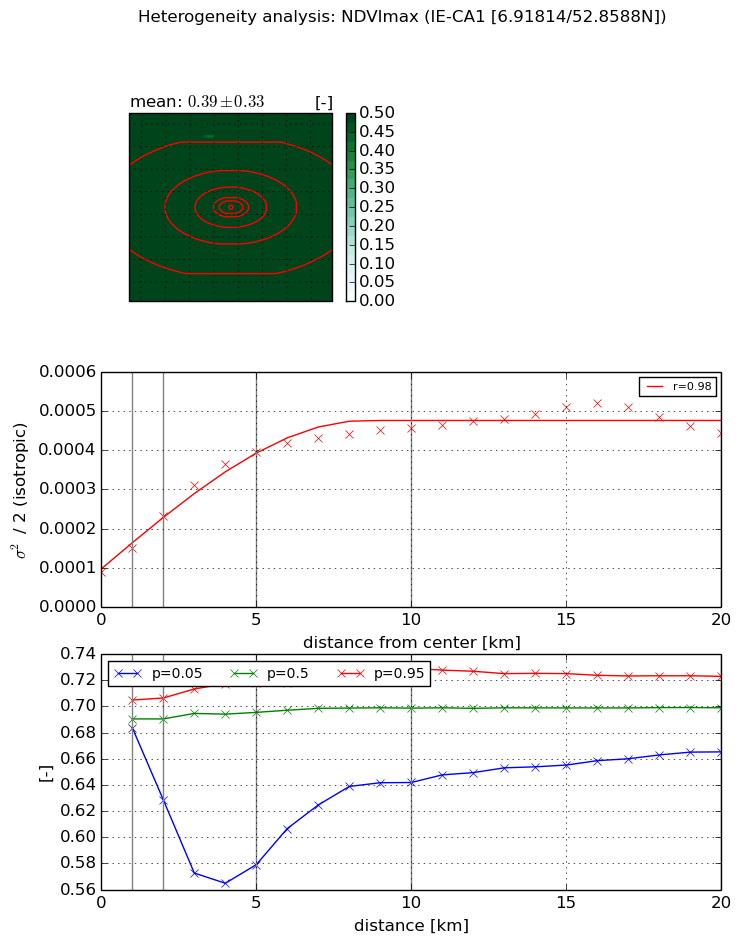
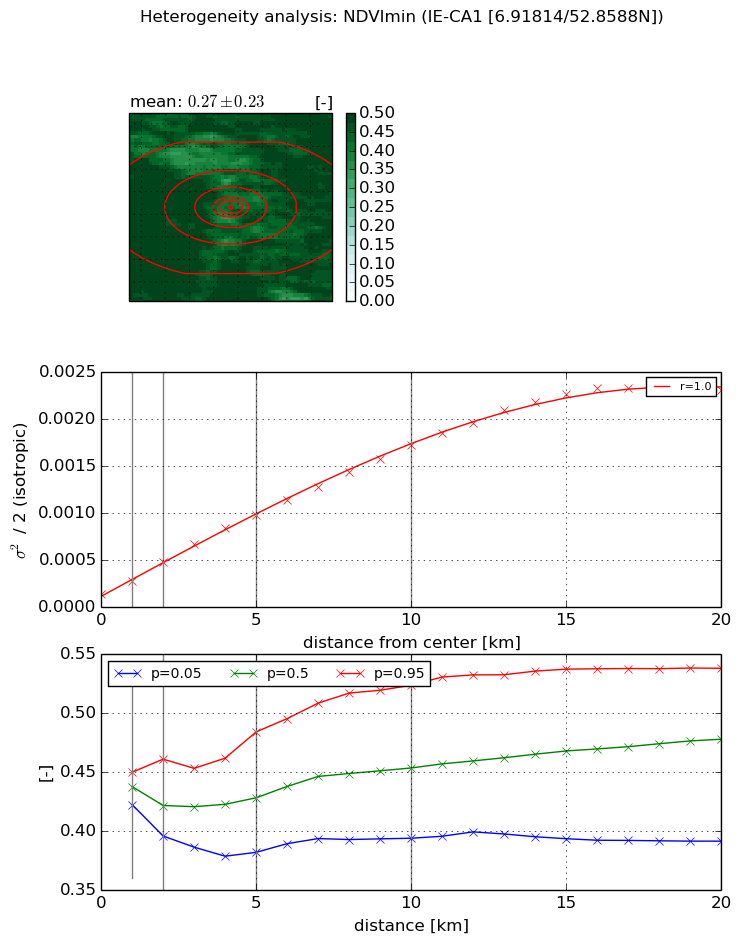
Heterogeneity analysis

The heterogeneity analysis provides information about the spatial and temporal heterogeneity of the site.

Topography


Roman et al. (2009) index


St

2.39629612085

Rcv

0.253474204575

Rse

0.0

Rst

-6.47990391661e-06

Rsv

-0.998451401


Height range @ 1km [m]

7

Height range @ 2km [m]

17

Height range @ 5km [m]

36

Height range @ 10km [m]

-999

Height range @ 20km [m]

-999


Variance slope @ 1 km

44

Variance slope @ 2 km

36

Variance slope @ 5 km

33

Variance slope @ 10 km

-999

Variance slope @ 20 km

-999


NDVI (max. NDVI composite)


Roman et al. (2009) index


St

4.25496582767

Rcv

-0.0806602627796

Rse

0.0

Rst

-0.355447294726

Rsv

-0.268950983856


NDVI range @ 1km [-]

0.02

NDVI range @ 2km [-]

0.08

NDVI range @ 5km [-]

0.14

NDVI range @ 10km [-]

0.09

NDVI range @ 20km [-]

0.06


Variance slope @ 1 km

6.27285147341e-05

Variance slope @ 2 km

7.18229940027e-05

Variance slope @ 5 km

6.45735518951e-05

Variance slope @ 10 km

3.60525442125e-05

Variance slope @ 20 km

1.52688380805e-05


NDVI (min. NDVI composite)I


Roman et al. (2009) index


St

2.2411480196

Rcv

0.281432998505

Rse

0.0

Rst

-0.212448662585

Rsv

0.844718009152


NDVI range @ 1km [-]

0.03

NDVI range @ 2km [-]

0.07

NDVI range @ 5km [-]

0.1

NDVI range @ 10km [-]

0.13

NDVI range @ 20km [-]

0.15


NDVI slope @ 1 km

0.000144870907767

NDVI slope @ 2 km

0.000168720342382

NDVI slope @ 5 km

0.000174049862083

NDVI slope @ 10 km

0.000159331712475

NDVI slope @ 20 km

0.000116375190176


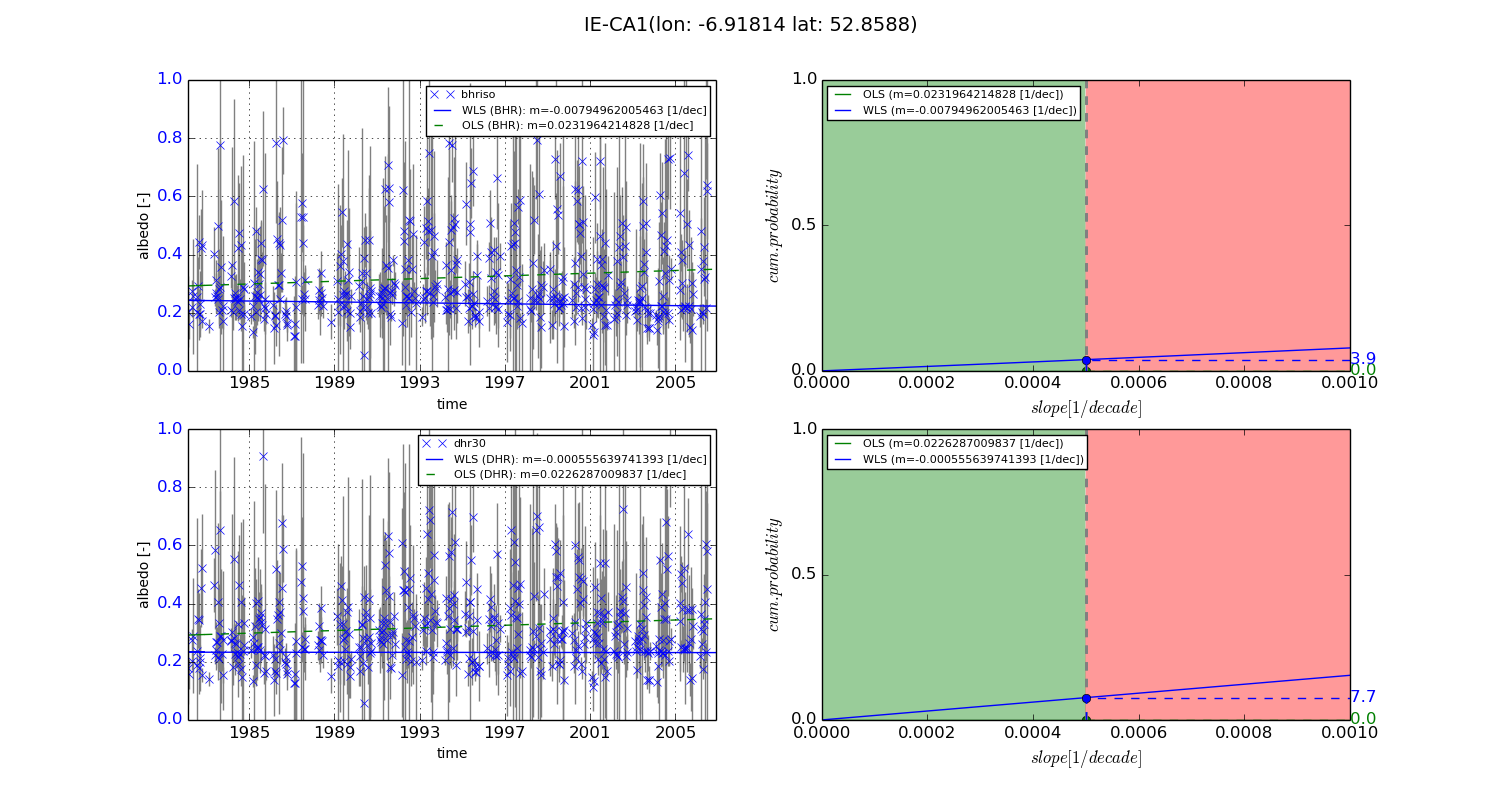
Temporal stability analysis

+000 deg (BHR)


BHR statistics

Temporal stability [1/decade]:


abs

rel


Weighted least square:

-0.00794962005463


Ordinary least square:

0.0231964214828


Probabilities that GCOS criteria is met:

Weighted least square:

3.9 %

Ordinary least square:

0.0 %


DHR statistics

Temporal stability [1/decade]:


abs

rel


Weighted least square:

-0.000555639741393


Ordinary least square:

0.0226287009837


Probabilities that GCOS criteria is met:

Weighted least square:

7.7 %

Ordinary least square:

0.0 %


+057/+063 deg (BHR)


BHR statistics

Temporal stability [1/decade]:


abs

rel


Weighted least square:

-99999.0


Ordinary least square:

-99999.0


Probabilities that GCOS criteria is met:

Weighted least square:

-99999.0 %

Ordinary least square:

-99999.0 %


DHR statistics

Temporal stability [1/decade]:


abs

rel


Weighted least square:

-99999.0


Ordinary least square:

-99999.0


Probabilities that GCOS criteria is met:

Weighted least square:

-99999.0 %

Ordinary least square:

-99999.0 %


Temporal anomaly analyis

The variance of the temporal anomalies provides an additional measure about the stability of the signal AFTER removal of the mean seasonal cylce.
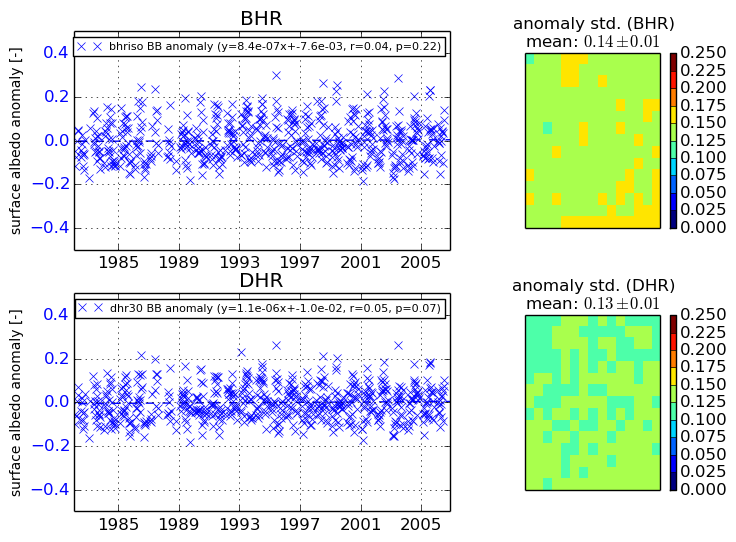
+000 deg


+057/+063 deg