IE-DRI


Location

lon / lat [deg]: -8.7518 / 51.9867

Source network: FLUXNET


Geostationary surface albedo (GSA) data


“+000”


“+057/+063”


Landcover information (based on ESA CCI landcover data)


Landcover fractions @ 2km distance


Landcover fractions @ 20 km distance


Legend


Distance to open water bodies [km]:

8.64

Distance to urban areas [km]:

4.25


Radius: 1 km

Number of landcover classes:

2

Dominant landcover type:

130: grassland

Fraction of dominant landcover type [%]:

96.0


Radius: 2 km

Number of landcover classes:

3

Dominant landcover type:

130: grassland

Fraction of dominant landcover type [%]:

95.0


Radius: 5 km

Number of landcover classes:

3

Dominant landcover type:

130: grassland

Fraction of dominant landcover type [%]:

83.0


Radius: 10 km

Number of landcover classes:

6

Dominant landcover type:

130: grassland

Fraction of dominant landcover type [%]:

78.0


Radius: 20 km

Number of landcover classes:

8

Dominant landcover type:

130: grassland

Fraction of dominant landcover type [%]:

74.0


Disturbances


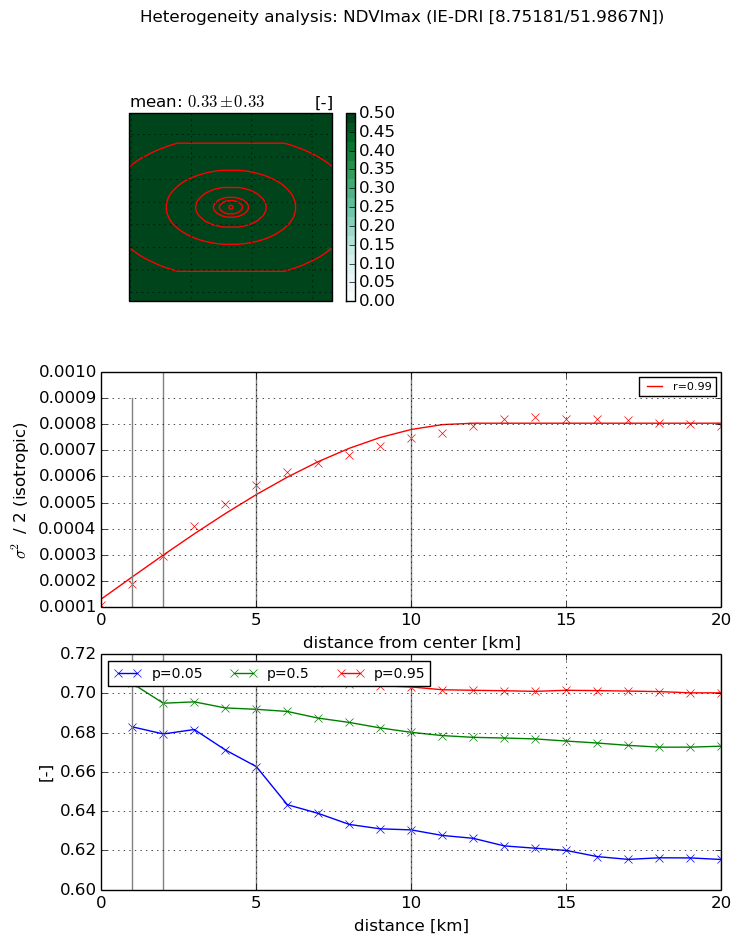
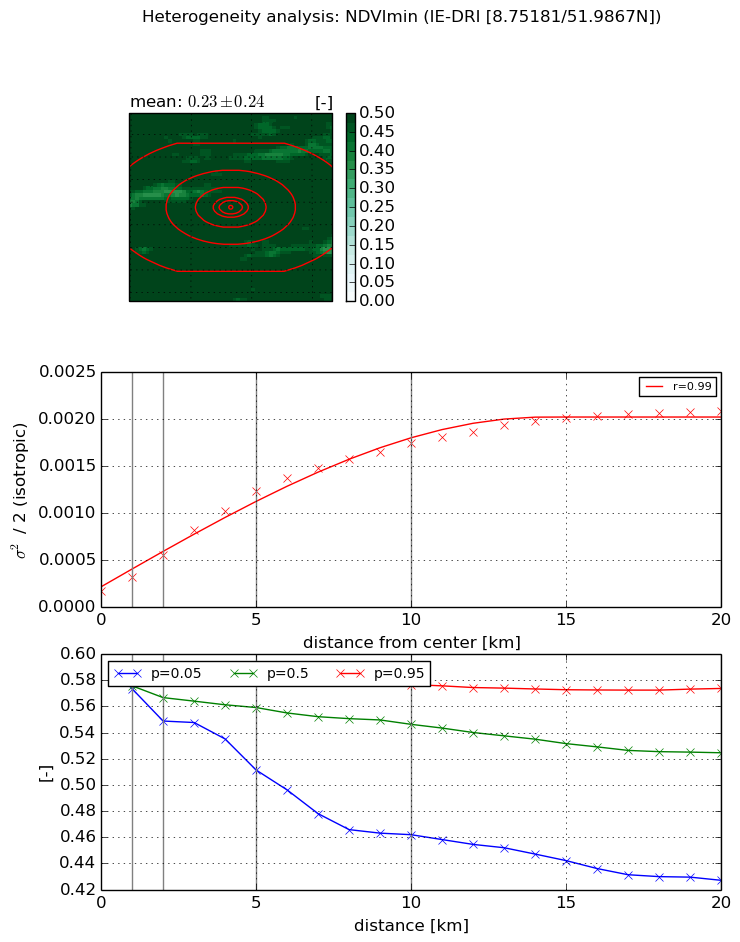
Heterogeneity analysis

The heterogeneity analysis provides information about the spatial and temporal heterogeneity of the site.

Topography


Roman et al. (2009) index


St

1.74872655623

Rcv

0.687978920481

Rse

0.0

Rst

0.0278209440202

Rsv

-0.999734213321


Height range @ 1km [m]

54

Height range @ 2km [m]

84

Height range @ 5km [m]

149

Height range @ 10km [m]

-999

Height range @ 20km [m]

-999


Variance slope @ 1 km

523

Variance slope @ 2 km

523

Variance slope @ 5 km

506

Variance slope @ 10 km

-999

Variance slope @ 20 km

-999


NDVI (max. NDVI composite)


Roman et al. (2009) index


St

0.391401814563

Rcv

0.462719390422

Rse

0.0

Rst

-0.696881402438

Rsv

6.50515672327


NDVI range @ 1km [-]

0.03

NDVI range @ 2km [-]

0.03

NDVI range @ 5km [-]

0.04

NDVI range @ 10km [-]

0.07

NDVI range @ 20km [-]

0.08


Variance slope @ 1 km

8.01416030378e-05

Variance slope @ 2 km

9.46491051341e-05

Variance slope @ 5 km

9.47634505804e-05

Variance slope @ 10 km

6.41765509661e-05

Variance slope @ 20 km

3.13060068572e-05


NDVI (min. NDVI composite)I


Roman et al. (2009) index


St

1.90760102242

Rcv

0.89216969972

Rse

0.0

Rst

-0.147842374129

Rsv

0.532643824704


NDVI range @ 1km [-]

0.01

NDVI range @ 2km [-]

0.03

NDVI range @ 5km [-]

0.07

NDVI range @ 10km [-]

0.11

NDVI range @ 20km [-]

0.15


NDVI slope @ 1 km

0.000148972703381

NDVI slope @ 2 km

0.000191323085961

NDVI slope @ 5 km

0.000219141434499

NDVI slope @ 10 km

0.000162880658889

NDVI slope @ 20 km

9.09525575773e-05


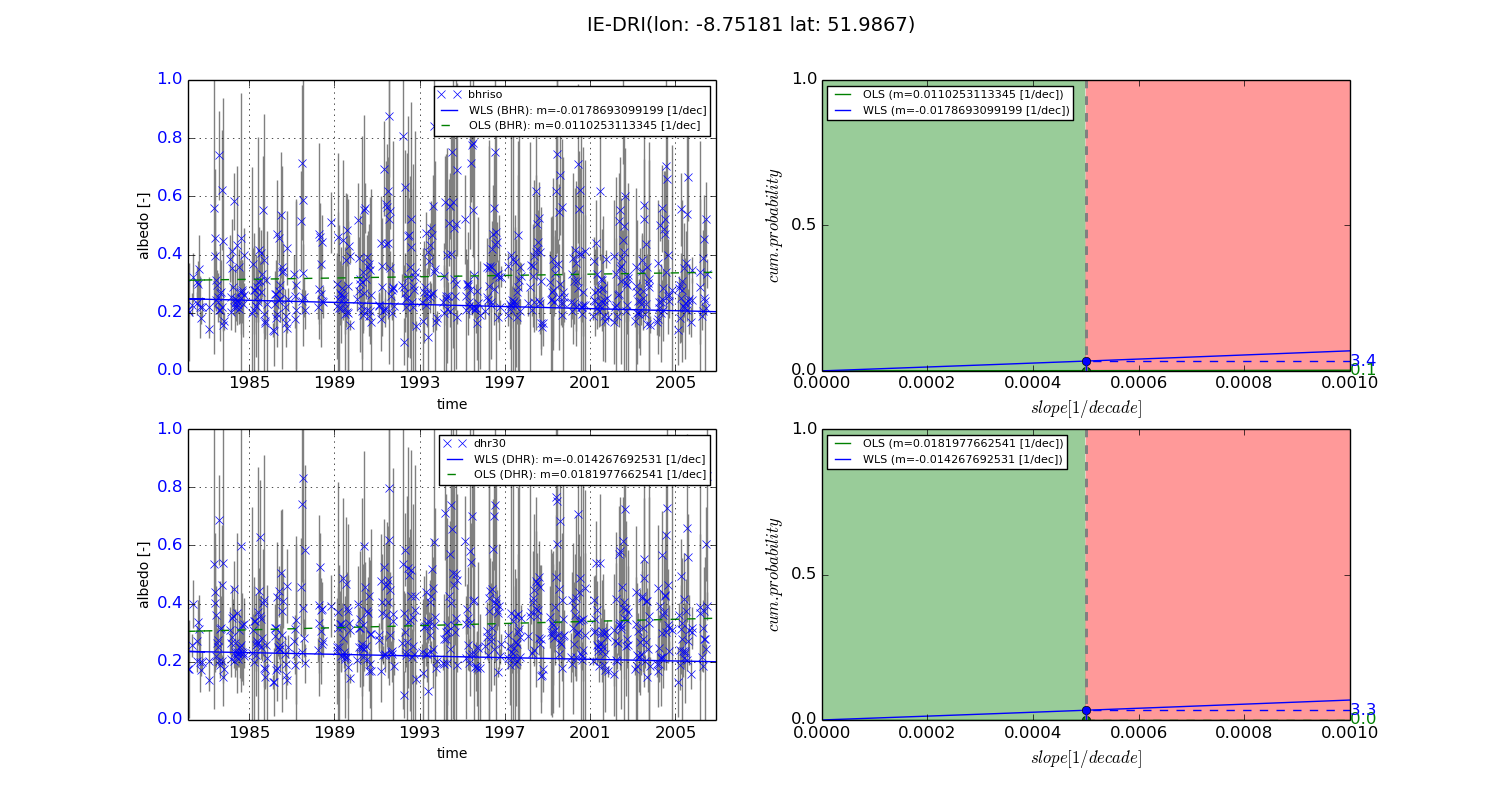
Temporal stability analysis

+000 deg (BHR)


BHR statistics

Temporal stability [1/decade]:


abs

rel


Weighted least square:

-0.0178693099199


Ordinary least square:

0.0110253113345


Probabilities that GCOS criteria is met:

Weighted least square:

3.4 %

Ordinary least square:

0.1 %


DHR statistics

Temporal stability [1/decade]:


abs

rel


Weighted least square:

-0.014267692531


Ordinary least square:

0.0181977662541


Probabilities that GCOS criteria is met:

Weighted least square:

3.3 %

Ordinary least square:

0.0 %


+057/+063 deg (BHR)


BHR statistics

Temporal stability [1/decade]:


abs

rel


Weighted least square:

-99999.0


Ordinary least square:

-99999.0


Probabilities that GCOS criteria is met:

Weighted least square:

-99999.0 %

Ordinary least square:

-99999.0 %


DHR statistics

Temporal stability [1/decade]:


abs

rel


Weighted least square:

-99999.0


Ordinary least square:

-99999.0


Probabilities that GCOS criteria is met:

Weighted least square:

-99999.0 %

Ordinary least square:

-99999.0 %


Temporal anomaly analyis

The variance of the temporal anomalies provides an additional measure about the stability of the signal AFTER removal of the mean seasonal cylce.
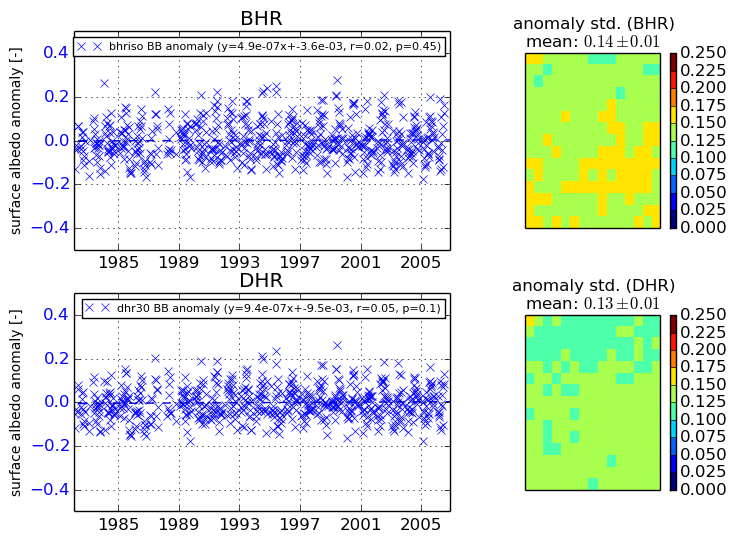
+000 deg


+057/+063 deg