IIT_KGP_EXT_KOLKATA


Location

lon / lat [deg]: 88.418 / 22.574

Source network: AERONET


Geostationary surface albedo (GSA) data


“+000”


“+057/+063”


Landcover information (based on ESA CCI landcover data)


Landcover fractions @ 2km distance


Landcover fractions @ 20 km distance


Legend


Distance to open water bodies [km]:

0.72

Distance to urban areas [km]:

0.04


Radius: 1 km

Number of landcover classes:

2

Dominant landcover type:

190: urban areas

Fraction of dominant landcover type [%]:

91.0


Radius: 2 km

Number of landcover classes:

2

Dominant landcover type:

190: urban areas

Fraction of dominant landcover type [%]:

85.0


Radius: 5 km

Number of landcover classes:

6

Dominant landcover type:

190: urban areas

Fraction of dominant landcover type [%]:

75.0


Radius: 10 km

Number of landcover classes:

6

Dominant landcover type:

190: urban areas

Fraction of dominant landcover type [%]:

65.0


Radius: 20 km

Number of landcover classes:

7

Dominant landcover type:

190: urban areas

Fraction of dominant landcover type [%]:

51.0


Disturbances


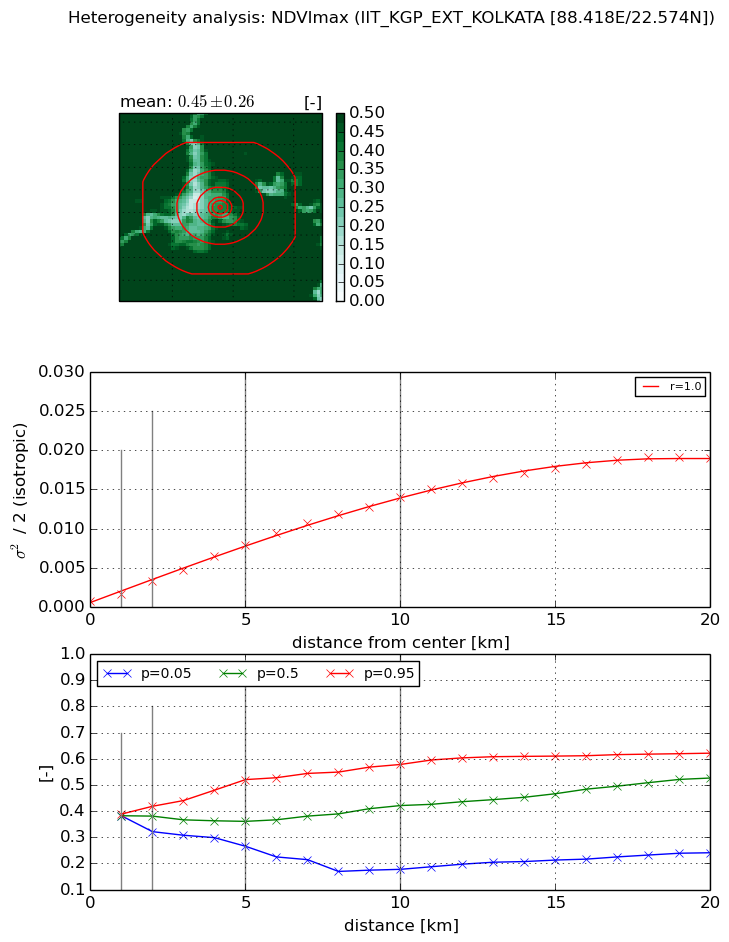
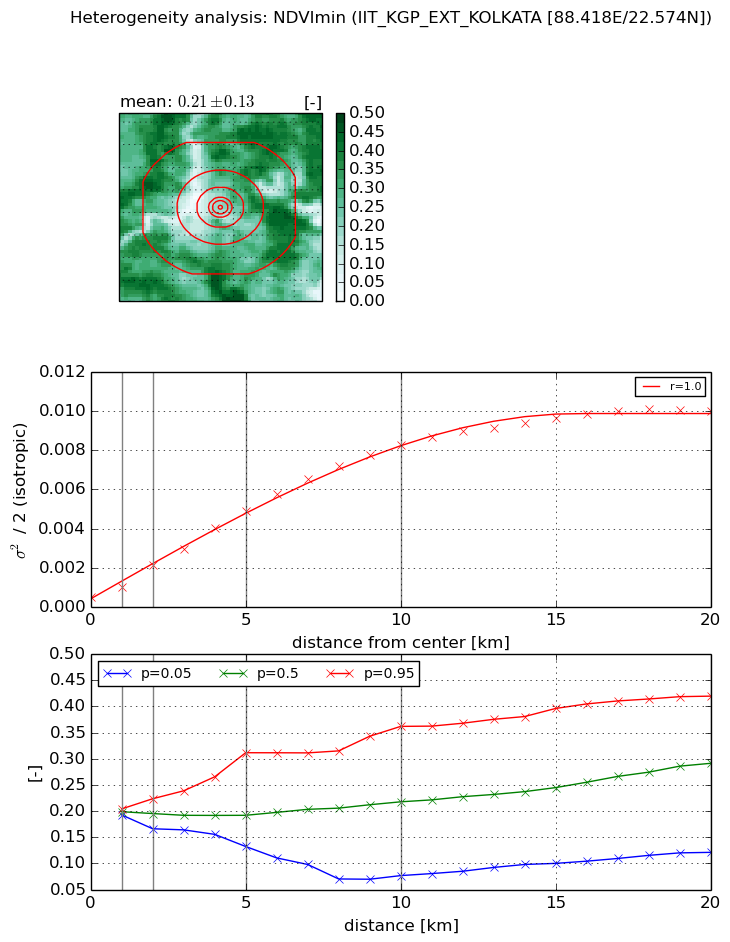
Heterogeneity analysis

The heterogeneity analysis provides information about the spatial and temporal heterogeneity of the site.

Topography


Roman et al. (2009) index


St

3.26953183126

Rcv

-0.0632872003356

Rse

0.0

Rst

-0.20706588541

Rsv

0.647209475143


Height range @ 1km [m]

5

Height range @ 2km [m]

6

Height range @ 5km [m]

6

Height range @ 10km [m]

-999

Height range @ 20km [m]

-999


Variance slope @ 1 km

1

Variance slope @ 2 km

0

Variance slope @ 5 km

0

Variance slope @ 10 km

-999

Variance slope @ 20 km

-999


NDVI (max. NDVI composite)


Roman et al. (2009) index


St

2.47620891949

Rcv

0.82699443975

Rse

0.0

Rst

-1.80130181731e-08

Rsv

-0.384534979996


NDVI range @ 1km [-]

0.01

NDVI range @ 2km [-]

0.1

NDVI range @ 5km [-]

0.25

NDVI range @ 10km [-]

0.4

NDVI range @ 20km [-]

0.38


Variance slope @ 1 km

0.000804786281305

Variance slope @ 2 km

0.00126581341701

Variance slope @ 5 km

0.00147297803307

Variance slope @ 10 km

0.00137055147108

Variance slope @ 20 km

0.000960668744632


NDVI (min. NDVI composite)I


Roman et al. (2009) index


St

0.36343572579

Rcv

1.09106217623

Rse

0.0

Rst

5.43333131867e-09

Rsv

7.16349230243


NDVI range @ 1km [-]

0.01

NDVI range @ 2km [-]

0.06

NDVI range @ 5km [-]

0.18

NDVI range @ 10km [-]

0.29

NDVI range @ 20km [-]

0.3


NDVI slope @ 1 km

0.000511937308869

NDVI slope @ 2 km

0.000798011495158

NDVI slope @ 5 km

0.000906961500101

NDVI slope @ 10 km

0.000813220342907

NDVI slope @ 20 km

0.000485795938799


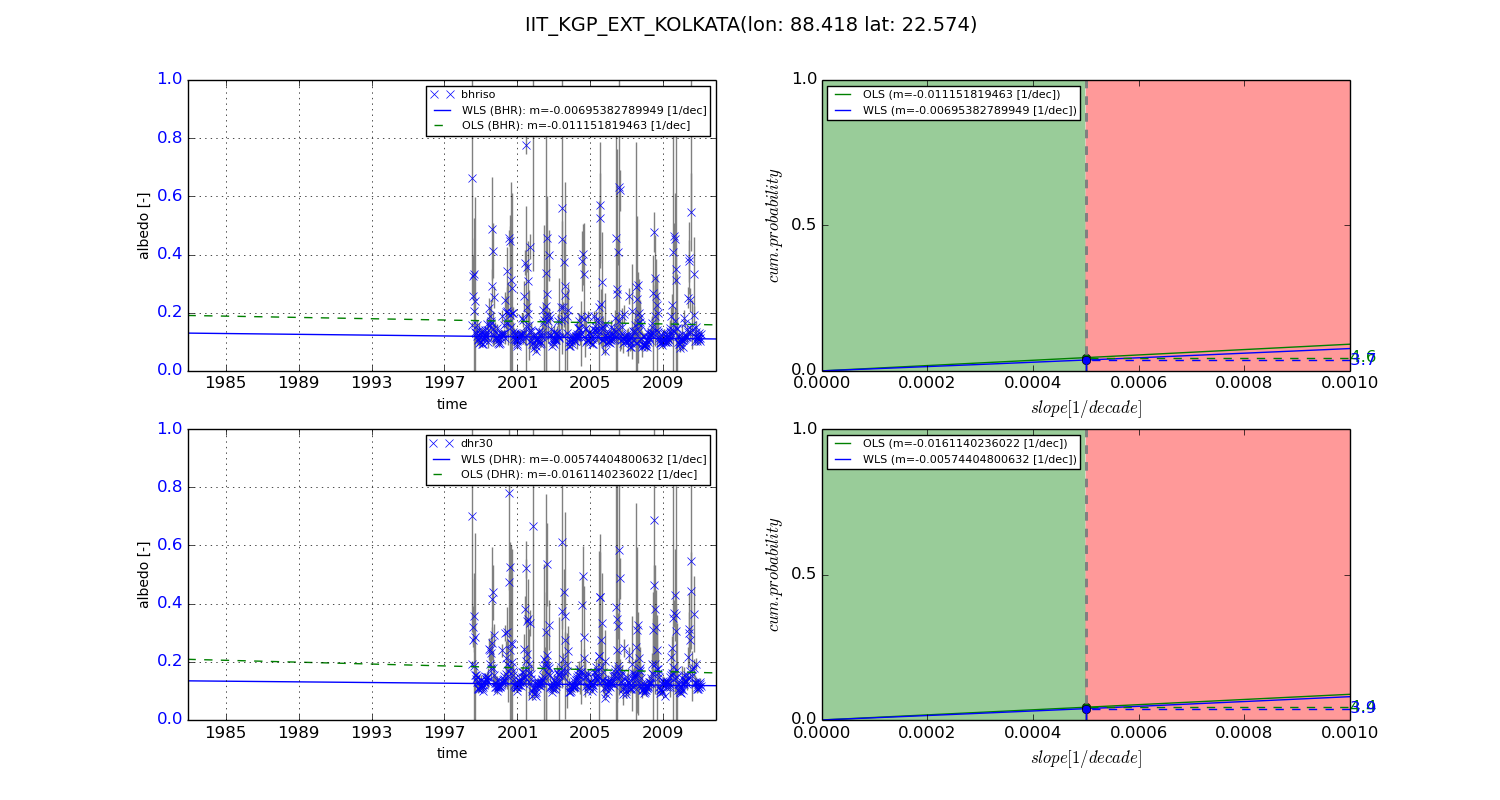
Temporal stability analysis

+000 deg (BHR)


BHR statistics

Temporal stability [1/decade]:


abs

rel


Weighted least square:

None


Ordinary least square:

None


Probabilities that GCOS criteria is met:

Weighted least square:

None %

Ordinary least square:

None %


DHR statistics

Temporal stability [1/decade]:


abs

rel


Weighted least square:

None


Ordinary least square:

None


Probabilities that GCOS criteria is met:

Weighted least square:

None %

Ordinary least square:

None %


+057/+063 deg (BHR)


BHR statistics

Temporal stability [1/decade]:


abs

rel


Weighted least square:

-0.00695382789949


Ordinary least square:

-0.011151819463


Probabilities that GCOS criteria is met:

Weighted least square:

3.7 %

Ordinary least square:

4.6 %


DHR statistics

Temporal stability [1/decade]:


abs

rel


Weighted least square:

-0.00574404800632


Ordinary least square:

-0.0161140236022


Probabilities that GCOS criteria is met:

Weighted least square:

3.9 %

Ordinary least square:

4.4 %


Temporal anomaly analyis

The variance of the temporal anomalies provides an additional measure about the stability of the signal AFTER removal of the mean seasonal cylce.

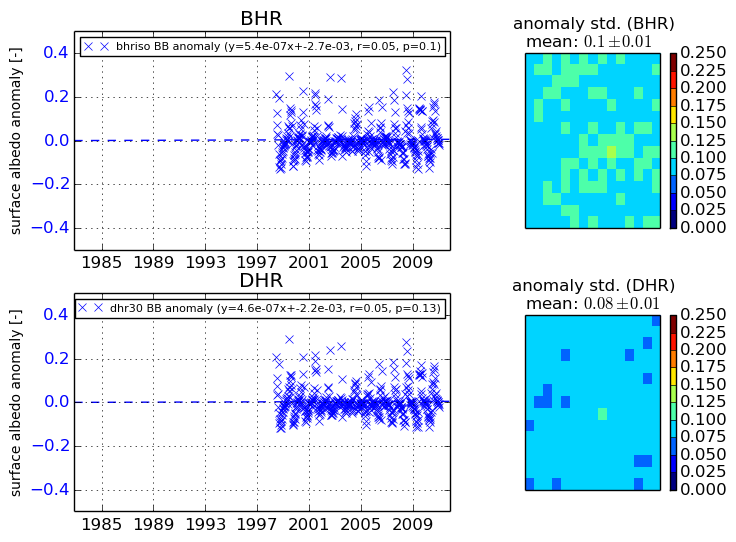
+000 deg


+057/+063 deg