ILORIN


Location

lon / lat [deg]: 4.34 / 8.32

Source network: AERONET


Geostationary surface albedo (GSA) data


“+000”


“+057/+063”


Landcover information (based on ESA CCI landcover data)


Landcover fractions @ 2km distance


Landcover fractions @ 20 km distance


Legend


Distance to open water bodies [km]:

21.07

Distance to urban areas [km]:

4.94


Radius: 1 km

Number of landcover classes:

5

Dominant landcover type:

120: Shrubland

Fraction of dominant landcover type [%]:

67.0


Radius: 2 km

Number of landcover classes:

6

Dominant landcover type:

120: Shrubland

Fraction of dominant landcover type [%]:

57.0


Radius: 5 km

Number of landcover classes:

5

Dominant landcover type:

120: Shrubland

Fraction of dominant landcover type [%]:

50.0


Radius: 10 km

Number of landcover classes:

6

Dominant landcover type:

120: Shrubland

Fraction of dominant landcover type [%]:

41.0


Radius: 20 km

Number of landcover classes:

6

Dominant landcover type:

120: Shrubland

Fraction of dominant landcover type [%]:

37.0


Disturbances


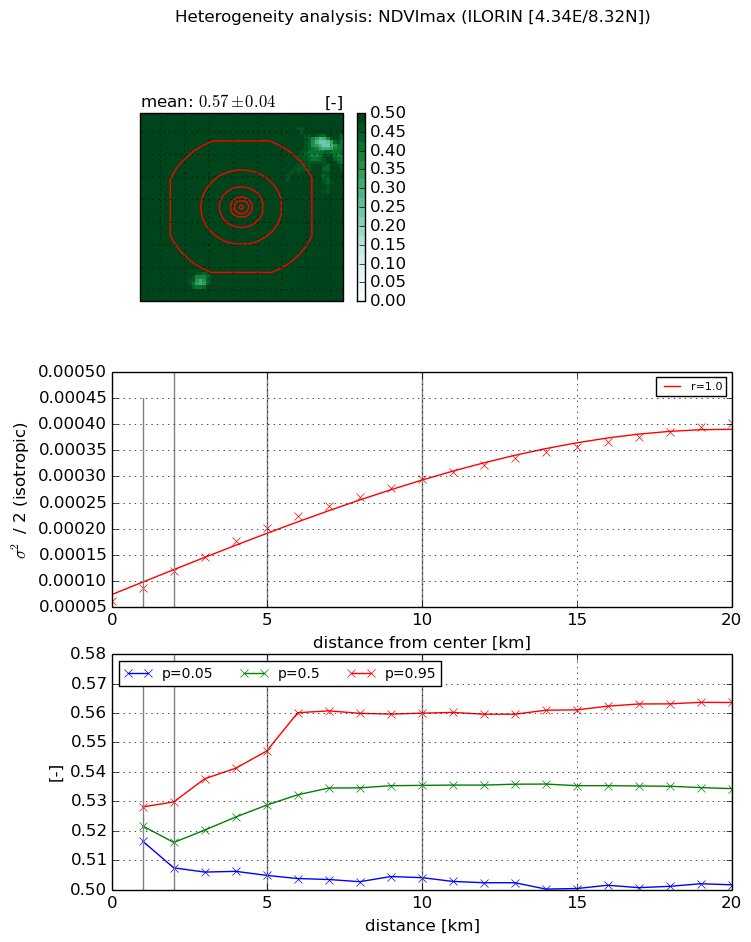
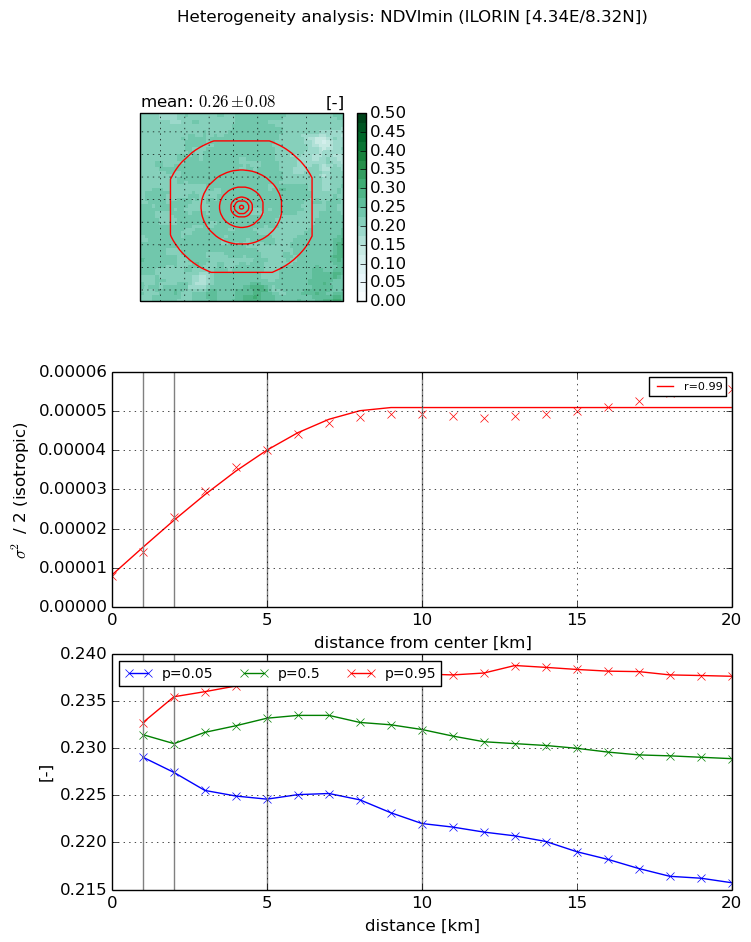
Heterogeneity analysis

The heterogeneity analysis provides information about the spatial and temporal heterogeneity of the site.

Topography


Roman et al. (2009) index


St

1.09113653975e-07

Rcv

0.139349858353

Rse

0.0

Rst

-0.060666648106

Rsv

27494267.3891


Height range @ 1km [m]

32

Height range @ 2km [m]

36

Height range @ 5km [m]

52

Height range @ 10km [m]

-999

Height range @ 20km [m]

-999


Variance slope @ 1 km

98

Variance slope @ 2 km

67

Variance slope @ 5 km

48

Variance slope @ 10 km

-999

Variance slope @ 20 km

-999


NDVI (max. NDVI composite)


Roman et al. (2009) index


St

1.85350052874

Rcv

0.422855836765

Rse

0.0

Rst

-0.195703322567

Rsv

-0.99999986101


NDVI range @ 1km [-]

0.01

NDVI range @ 2km [-]

0.02

NDVI range @ 5km [-]

0.04

NDVI range @ 10km [-]

0.06

NDVI range @ 20km [-]

0.06


Variance slope @ 1 km

2.33919610504e-05

Variance slope @ 2 km

2.84507524775e-05

Variance slope @ 5 km

2.84504165389e-05

Variance slope @ 10 km

2.3552757252e-05

Variance slope @ 20 km

1.64979615626e-05


NDVI (min. NDVI composite)I


Roman et al. (2009) index


St

2.21785564412

Rcv

0.314083542947

Rse

0.0

Rst

-0.151475723946

Rsv

0.887098652007


NDVI range @ 1km [-]

0.0

NDVI range @ 2km [-]

0.01

NDVI range @ 5km [-]

0.01

NDVI range @ 10km [-]

0.02

NDVI range @ 20km [-]

0.02


NDVI slope @ 1 km

5.96124960676e-06

NDVI slope @ 2 km

7.48778452256e-06

NDVI slope @ 5 km

6.66417976882e-06

NDVI slope @ 10 km

4.24104938054e-06

NDVI slope @ 20 km

1.85318176774e-06


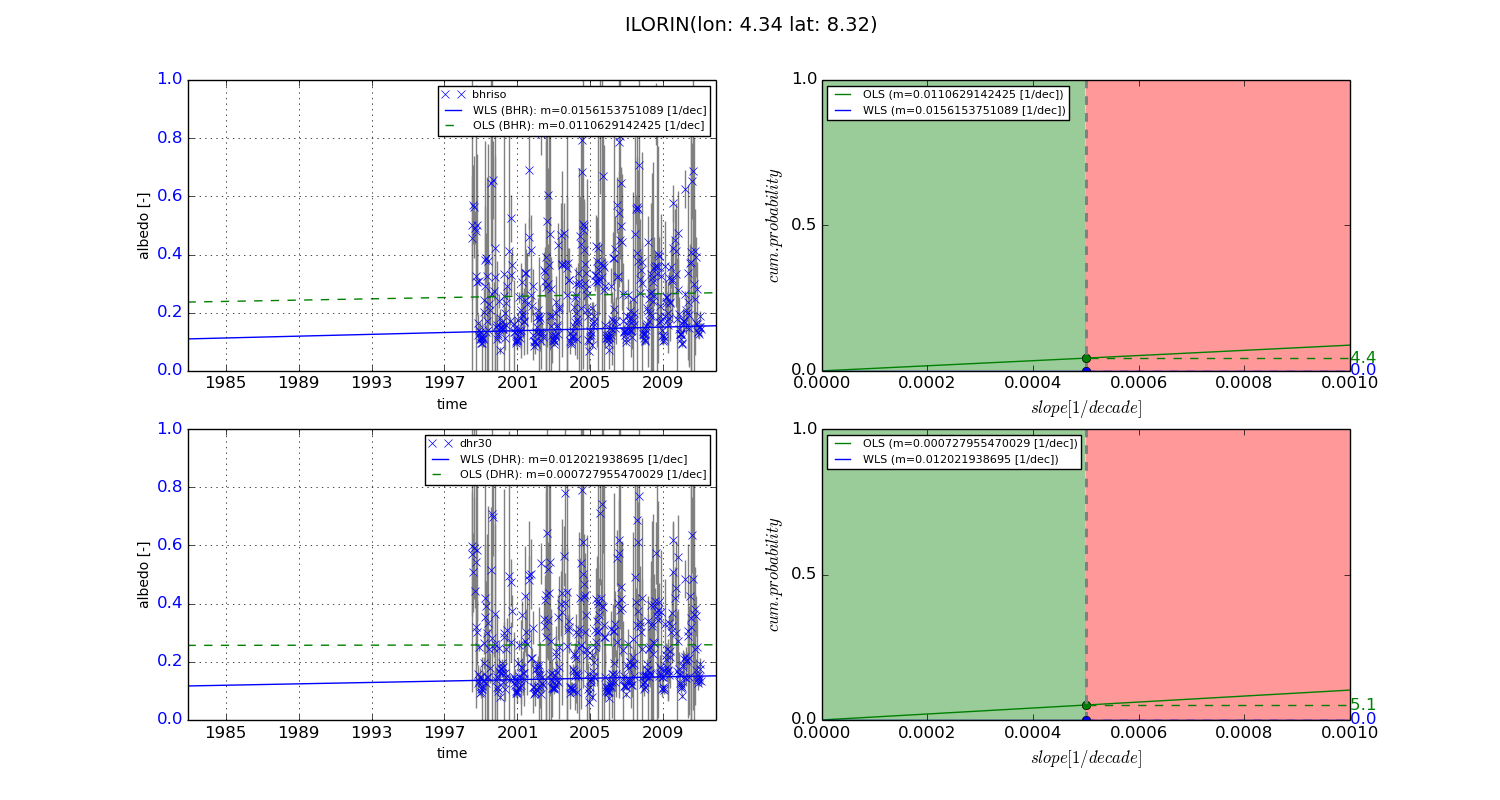
Temporal stability analysis

+000 deg (BHR)


BHR statistics

Temporal stability [1/decade]:


abs

rel


Weighted least square:

0.00243903415009


Ordinary least square:

-0.000384762976126


Probabilities that GCOS criteria is met:

Weighted least square:

6.5 %

Ordinary least square:

6.2 %


DHR statistics

Temporal stability [1/decade]:


abs

rel


Weighted least square:

0.00030722224265


Ordinary least square:

-0.00151834916571


Probabilities that GCOS criteria is met:

Weighted least square:

14.7 %

Ordinary least square:

6.1 %


+057/+063 deg (BHR)


BHR statistics

Temporal stability [1/decade]:


abs

rel


Weighted least square:

0.0156153751089


Ordinary least square:

0.0110629142425


Probabilities that GCOS criteria is met:

Weighted least square:

0.0 %

Ordinary least square:

4.4 %


DHR statistics

Temporal stability [1/decade]:


abs

rel


Weighted least square:

0.012021938695


Ordinary least square:

0.000727955470029


Probabilities that GCOS criteria is met:

Weighted least square:

0.0 %

Ordinary least square:

5.1 %


Temporal anomaly analyis

The variance of the temporal anomalies provides an additional measure about the stability of the signal AFTER removal of the mean seasonal cylce.
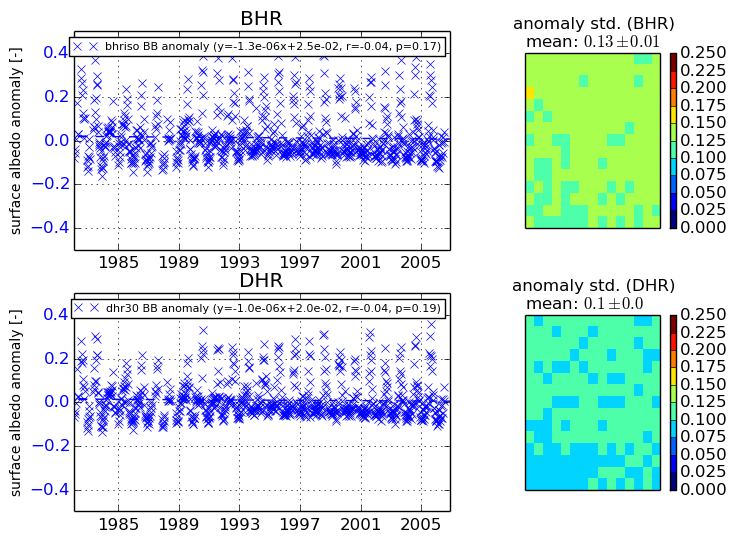
+000 deg


+057/+063 deg