IMAA_POTENZA


Location

lon / lat [deg]: 15.72 / 40.6

Source network: AERONET


Geostationary surface albedo (GSA) data


“+000”


“+057/+063”


Landcover information (based on ESA CCI landcover data)


Landcover fractions @ 2km distance


Landcover fractions @ 20 km distance


Legend


Distance to open water bodies [km]:

1.78

Distance to urban areas [km]:

0.17


Radius: 1 km

Number of landcover classes:

3

Dominant landcover type:

190: urban areas

Fraction of dominant landcover type [%]:

67.0


Radius: 2 km

Number of landcover classes:

4

Dominant landcover type:

190: urban areas

Fraction of dominant landcover type [%]:

39.0


Radius: 5 km

Number of landcover classes:

4

Dominant landcover type:

10: cropland, rainfed

Fraction of dominant landcover type [%]:

69.0


Radius: 10 km

Number of landcover classes:

5

Dominant landcover type:

10: cropland, rainfed

Fraction of dominant landcover type [%]:

55.0


Radius: 20 km

Number of landcover classes:

5

Dominant landcover type:

10: cropland, rainfed

Fraction of dominant landcover type [%]:

59.0


Disturbances


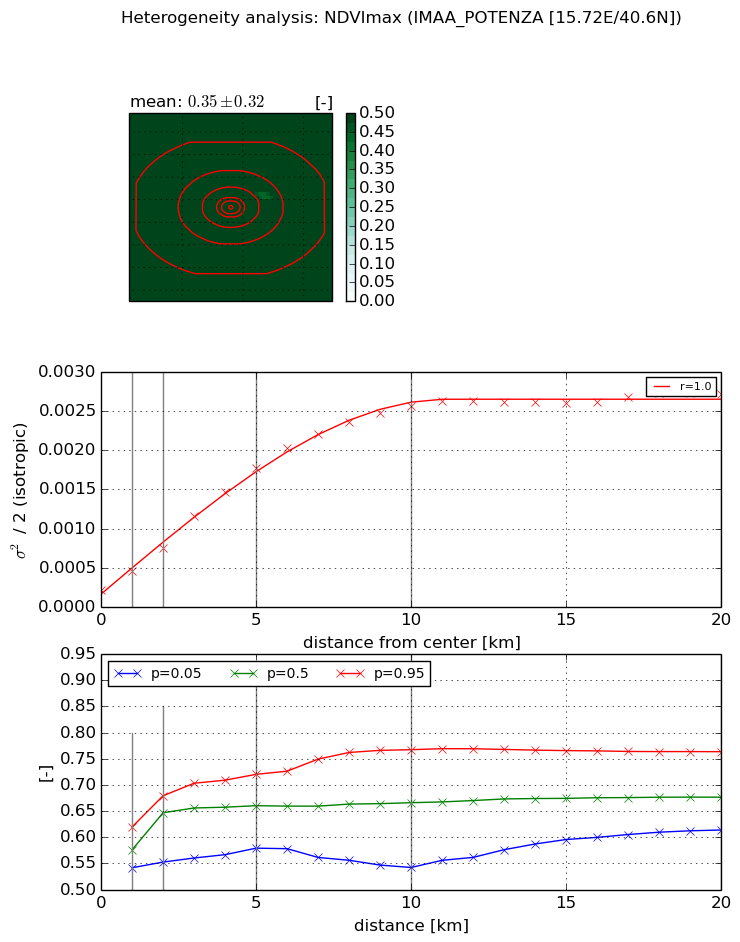
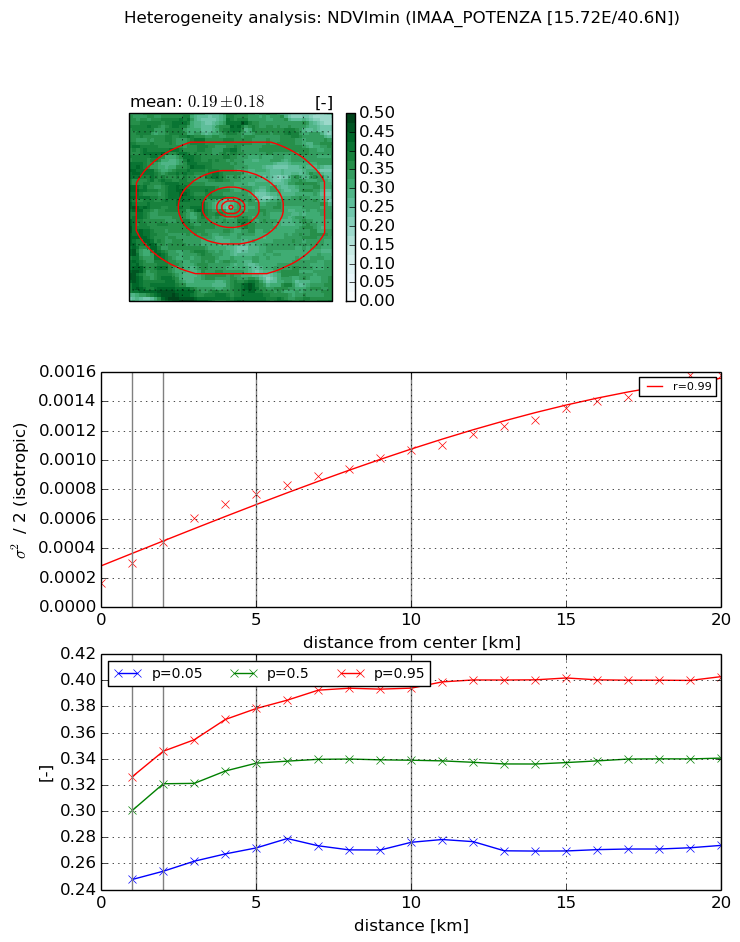
Heterogeneity analysis

The heterogeneity analysis provides information about the spatial and temporal heterogeneity of the site.

Topography


Roman et al. (2009) index


St

3.25340485511

Rcv

0.513524046718

Rse

0.0

Rst

0.00491093431465

Rsv

0.403675894681


Height range @ 1km [m]

69

Height range @ 2km [m]

193

Height range @ 5km [m]

439

Height range @ 10km [m]

-999

Height range @ 20km [m]

-999


Variance slope @ 1 km

4218

Variance slope @ 2 km

5187

Variance slope @ 5 km

5217

Variance slope @ 10 km

-999

Variance slope @ 20 km

-999


NDVI (max. NDVI composite)


Roman et al. (2009) index


St

1.72209272368

Rcv

-0.168572014881

Rse

0.0

Rst

-0.557144461821

Rsv

1.01634999785


NDVI range @ 1km [-]

0.08

NDVI range @ 2km [-]

0.13

NDVI range @ 5km [-]

0.14

NDVI range @ 10km [-]

0.23

NDVI range @ 20km [-]

0.15


Variance slope @ 1 km

0.000239820452818

Variance slope @ 2 km

0.000266034527958

Variance slope @ 5 km

0.000321012628005

Variance slope @ 10 km

0.000248160632142

Variance slope @ 20 km

0.000113224399528


NDVI (min. NDVI composite)I


Roman et al. (2009) index


St

2.70034912254

Rcv

-0.149333547324

Rse

0.0

Rst

0.713036500275

Rsv

-0.248597410258


NDVI range @ 1km [-]

0.08

NDVI range @ 2km [-]

0.09

NDVI range @ 5km [-]

0.11

NDVI range @ 10km [-]

0.12

NDVI range @ 20km [-]

0.13


NDVI slope @ 1 km

0.000140024935594

NDVI slope @ 2 km

0.000141882391201

NDVI slope @ 5 km

0.00012571535854

NDVI slope @ 10 km

8.69320214852e-05

NDVI slope @ 20 km

6.55394401695e-05


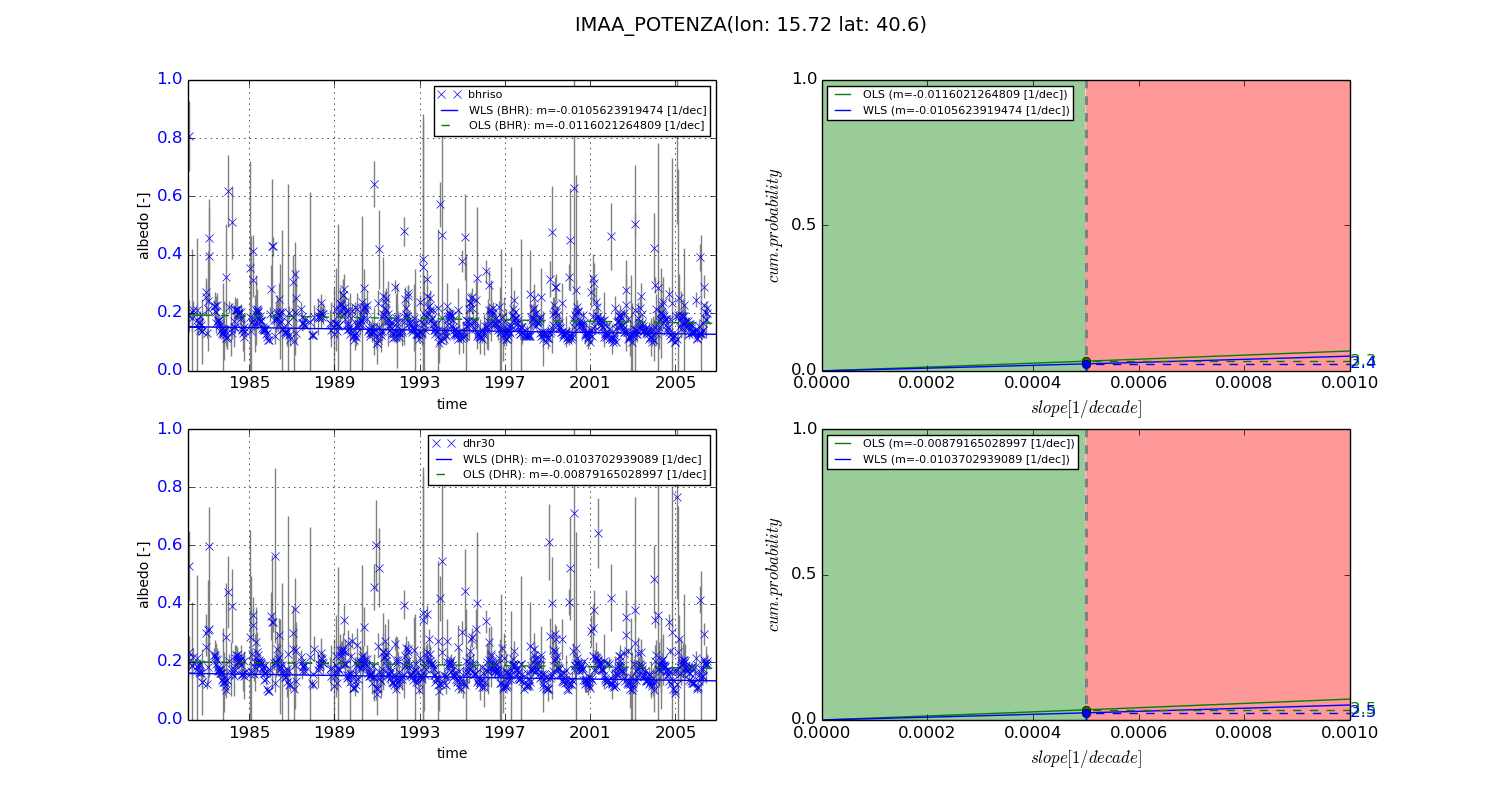
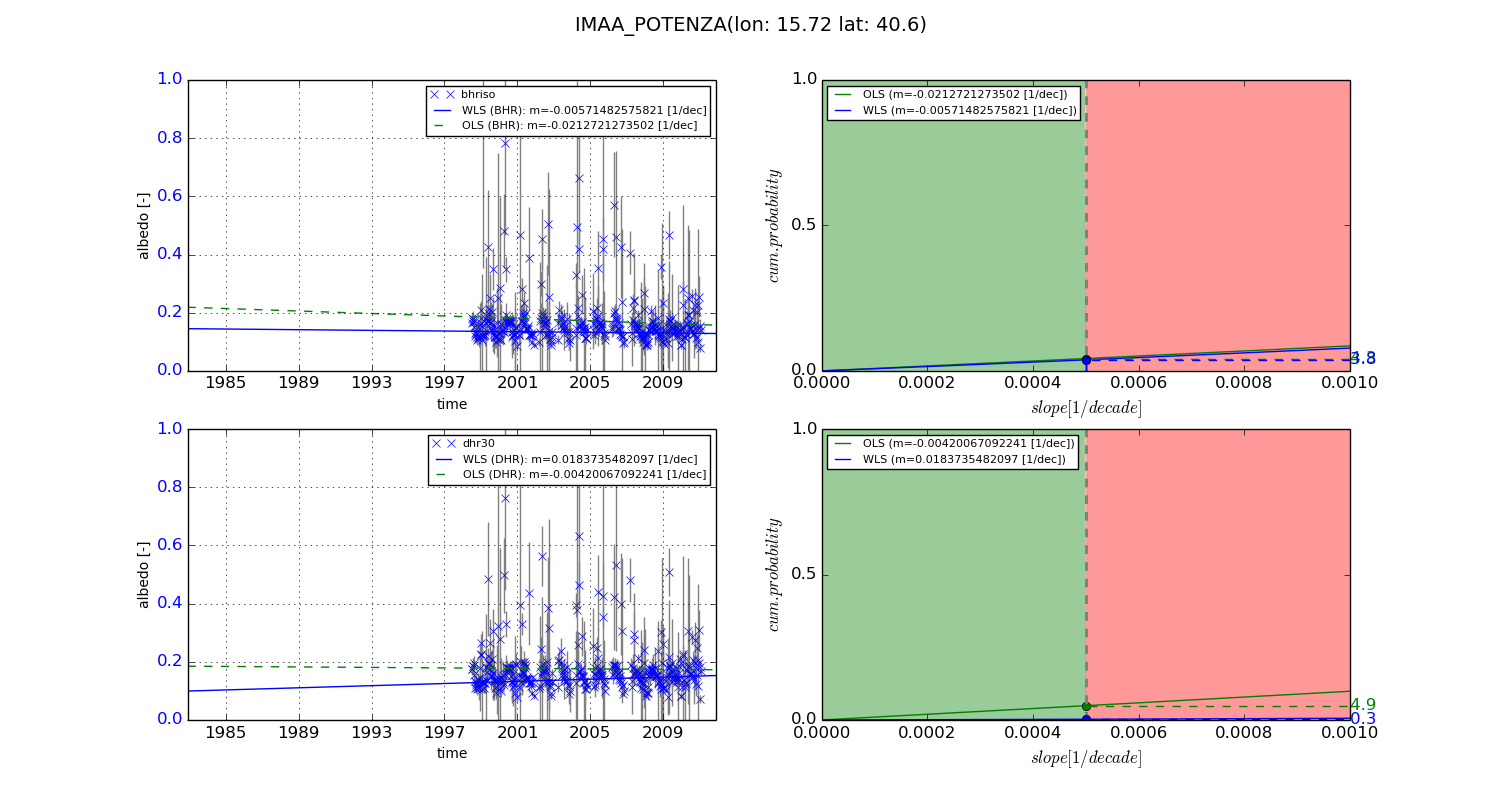
Temporal stability analysis

+000 deg (BHR)


BHR statistics

Temporal stability [1/decade]:


abs

rel


Weighted least square:

-0.0105623919474


Ordinary least square:

-0.0116021264809


Probabilities that GCOS criteria is met:

Weighted least square:

2.4 %

Ordinary least square:

3.3 %


DHR statistics

Temporal stability [1/decade]:


abs

rel


Weighted least square:

-0.0103702939089


Ordinary least square:

-0.00879165028997


Probabilities that GCOS criteria is met:

Weighted least square:

2.5 %

Ordinary least square:

3.5 %


+057/+063 deg (BHR)


BHR statistics

Temporal stability [1/decade]:


abs

rel


Weighted least square:

-0.00571482575821


Ordinary least square:

-0.0212721273502


Probabilities that GCOS criteria is met:

Weighted least square:

3.8 %

Ordinary least square:

4.3 %


DHR statistics

Temporal stability [1/decade]:


abs

rel


Weighted least square:

0.0183735482097


Ordinary least square:

-0.00420067092241


Probabilities that GCOS criteria is met:

Weighted least square:

0.3 %

Ordinary least square:

4.9 %


Temporal anomaly analyis

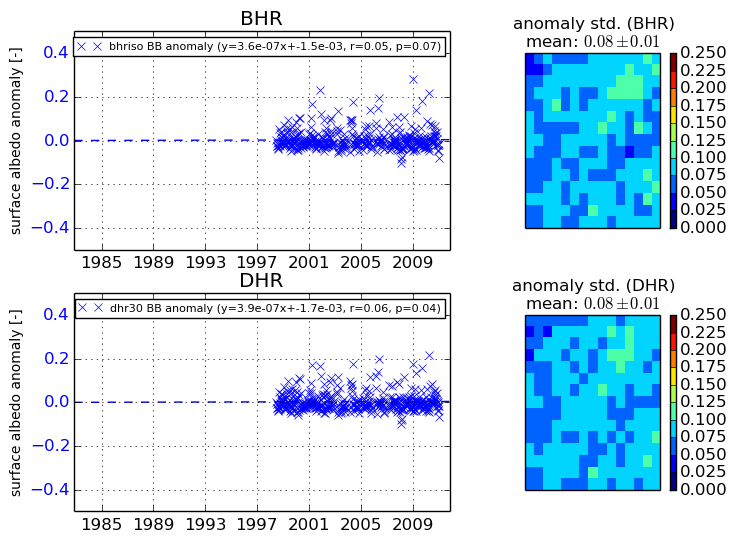
The variance of the temporal anomalies provides an additional measure about the stability of the signal AFTER removal of the mean seasonal cylce.
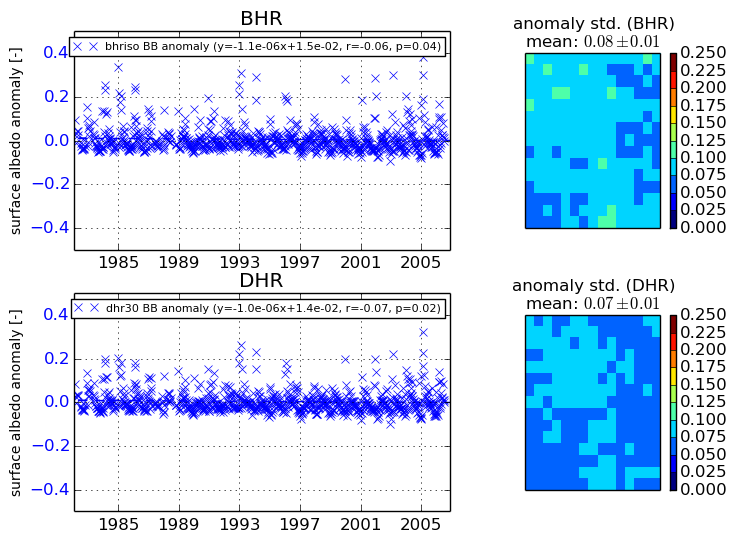
+000 deg


+057/+063 deg