INNER_MONGOLIA


Location

lon / lat [deg]: 115.9537 / 42.6832

Source network: AERONET


Geostationary surface albedo (GSA) data


“+000”


“+057/+063”


Landcover information (based on ESA CCI landcover data)


Landcover fractions @ 2km distance


Landcover fractions @ 20 km distance


Legend


Distance to open water bodies [km]:

7.71

Distance to urban areas [km]:

47.16


Radius: 1 km

Number of landcover classes:

1

Dominant landcover type:

130: grassland

Fraction of dominant landcover type [%]:

100.0


Radius: 2 km

Number of landcover classes:

5

Dominant landcover type:

130: grassland

Fraction of dominant landcover type [%]:

58.0


Radius: 5 km

Number of landcover classes:

5

Dominant landcover type:

130: grassland

Fraction of dominant landcover type [%]:

37.0


Radius: 10 km

Number of landcover classes:

5

Dominant landcover type:

20: cropland, irrigated or post-flooded

Fraction of dominant landcover type [%]:

42.0


Radius: 20 km

Number of landcover classes:

6

Dominant landcover type:

130: grassland

Fraction of dominant landcover type [%]:

35.0


Disturbances


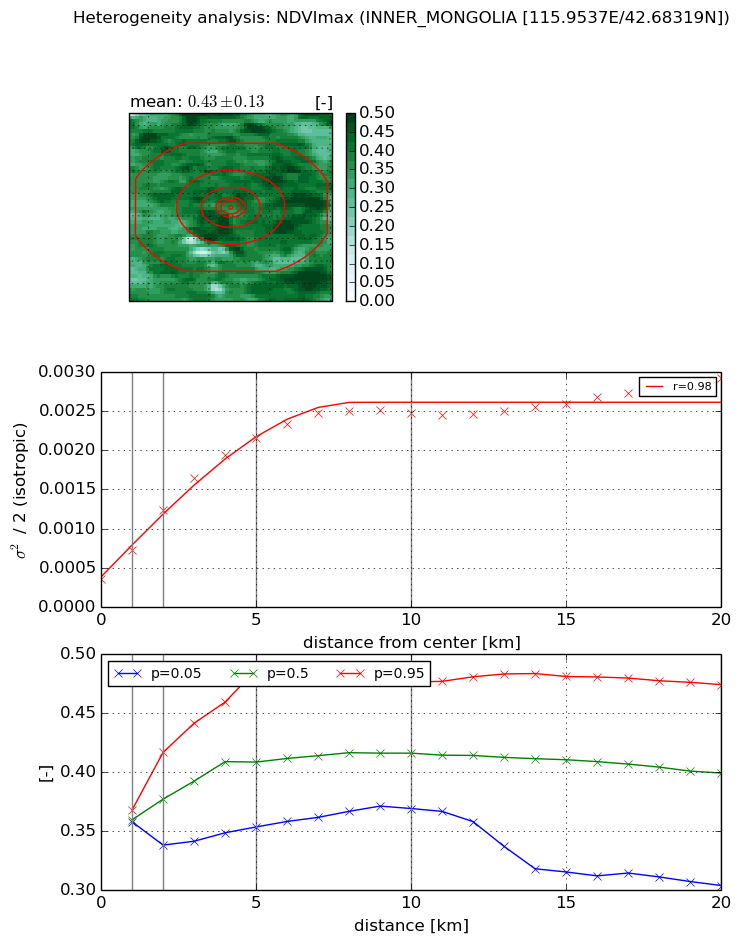
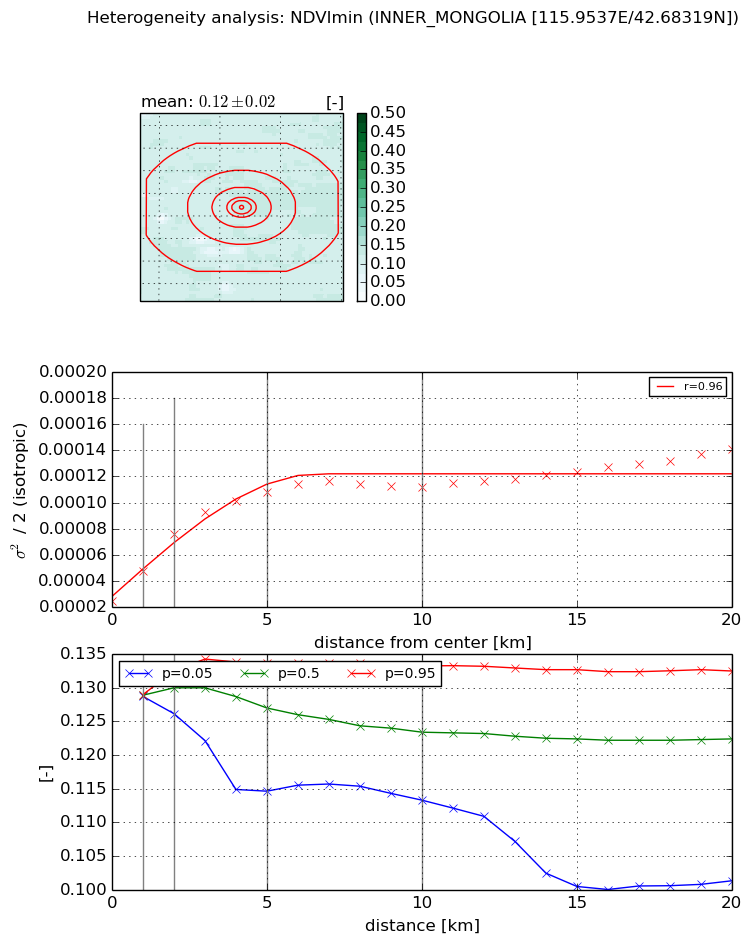
Heterogeneity analysis

The heterogeneity analysis provides information about the spatial and temporal heterogeneity of the site.

Topography


Roman et al. (2009) index


St

2.5602839845

Rcv

0.57576262718

Rse

0.0

Rst

-7.608212864e-09

Rsv

-0.595982381844


Height range @ 1km [m]

9

Height range @ 2km [m]

13

Height range @ 5km [m]

28

Height range @ 10km [m]

-999

Height range @ 20km [m]

-999


Variance slope @ 1 km

16

Variance slope @ 2 km

14

Variance slope @ 5 km

16

Variance slope @ 10 km

-999

Variance slope @ 20 km

-999


NDVI (max. NDVI composite)


Roman et al. (2009) index


St

12.167738179

Rcv

0.134233715703

Rse

0.0

Rst

0.0198574252212

Rsv

0.0924624876846


NDVI range @ 1km [-]

0.01

NDVI range @ 2km [-]

0.08

NDVI range @ 5km [-]

0.13

NDVI range @ 10km [-]

0.11

NDVI range @ 20km [-]

0.17


Variance slope @ 1 km

0.000380028600955

Variance slope @ 2 km

0.000443810452847

Variance slope @ 5 km

0.000371175204817

Variance slope @ 10 km

0.000213777797589

Variance slope @ 20 km

9.38707116724e-05


NDVI (min. NDVI composite)I


Roman et al. (2009) index


St

2.93035697441e-06

Rcv

0.603288241651

Rse

0.0

Rst

0.188624479243

Rsv

1023765.26328


NDVI range @ 1km [-]

0.0

NDVI range @ 2km [-]

0.01

NDVI range @ 5km [-]

0.02

NDVI range @ 10km [-]

0.02

NDVI range @ 20km [-]

0.03


NDVI slope @ 1 km

2.34603650774e-05

NDVI slope @ 2 km

2.56726965783e-05

NDVI slope @ 5 km

1.7028351007e-05

NDVI slope @ 10 km

7.90345062536e-06

NDVI slope @ 20 km

3.82978332859e-06


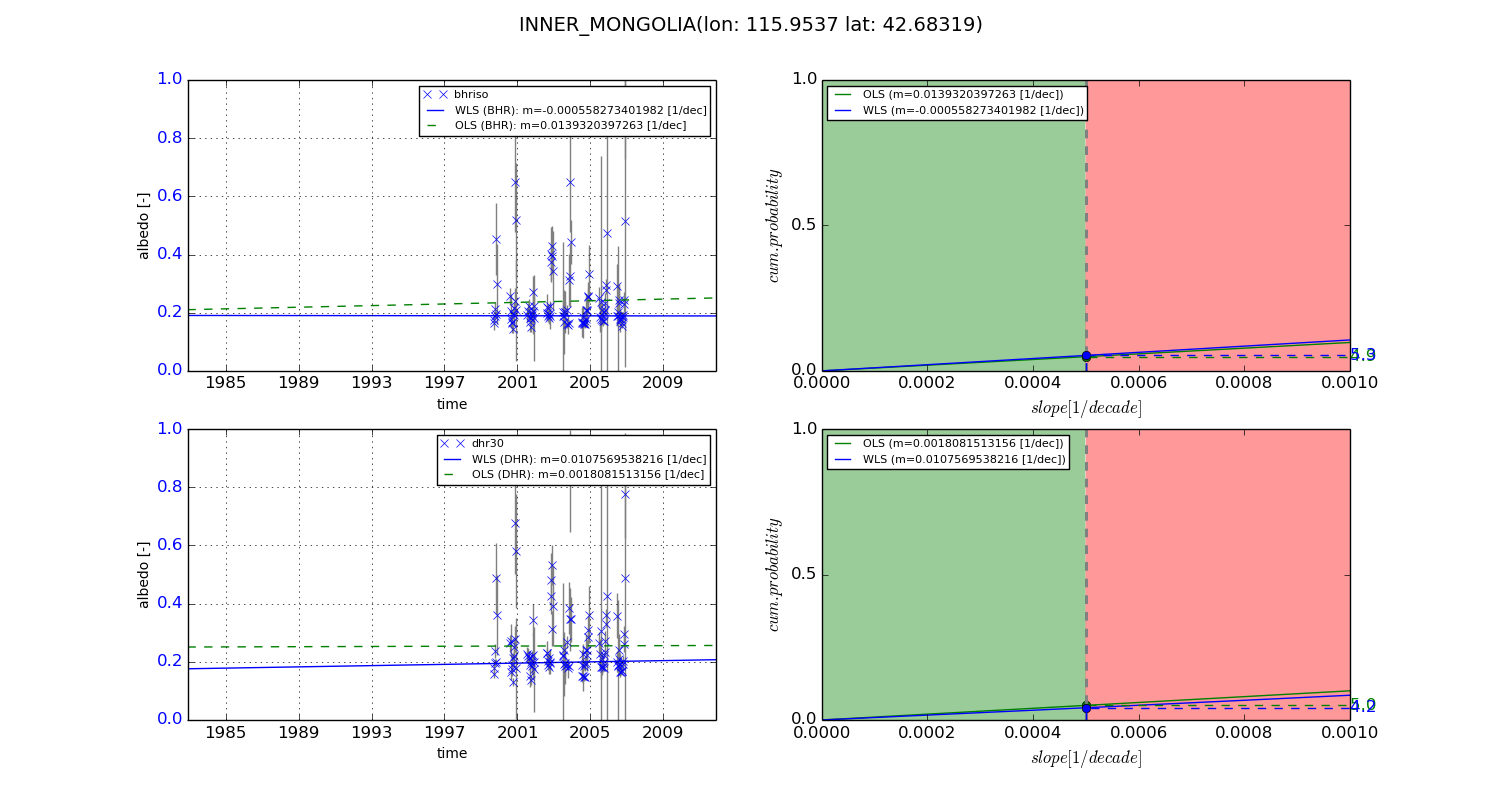
Temporal stability analysis

+000 deg (BHR)


BHR statistics

Temporal stability [1/decade]:


abs

rel


Weighted least square:

None


Ordinary least square:

None


Probabilities that GCOS criteria is met:

Weighted least square:

None %

Ordinary least square:

None %


DHR statistics

Temporal stability [1/decade]:


abs

rel


Weighted least square:

None


Ordinary least square:

None


Probabilities that GCOS criteria is met:

Weighted least square:

None %

Ordinary least square:

None %


+057/+063 deg (BHR)


BHR statistics

Temporal stability [1/decade]:


abs

rel


Weighted least square:

-0.000558273401982


Ordinary least square:

0.0139320397263


Probabilities that GCOS criteria is met:

Weighted least square:

5.3 %

Ordinary least square:

4.9 %


DHR statistics

Temporal stability [1/decade]:


abs

rel


Weighted least square:

0.0107569538216


Ordinary least square:

0.0018081513156


Probabilities that GCOS criteria is met:

Weighted least square:

4.2 %

Ordinary least square:

5.0 %


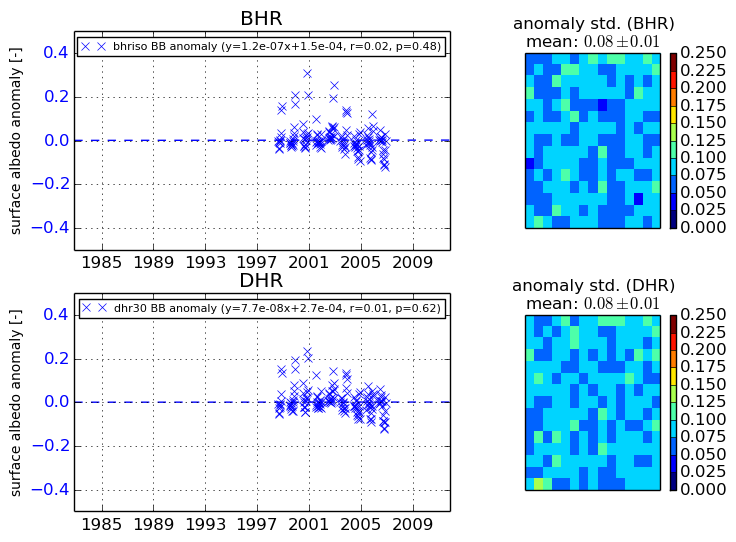
Temporal anomaly analyis

The variance of the temporal anomalies provides an additional measure about the stability of the signal AFTER removal of the mean seasonal cylce.

+000 deg


+057/+063 deg