IRKUTSK


Location

lon / lat [deg]: 103.0866 / 51.7998

Source network: AERONET


Geostationary surface albedo (GSA) data


“+000”


“+057/+063”


Landcover information (based on ESA CCI landcover data)


Landcover fractions @ 2km distance


Landcover fractions @ 20 km distance


Legend


Distance to open water bodies [km]:

0.55

Distance to urban areas [km]:

3.15


Radius: 1 km

Number of landcover classes:

4

Dominant landcover type:

80: Tree cover, needleleaved, deciduous, closed to open (>15%)

Fraction of dominant landcover type [%]:

84.0


Radius: 2 km

Number of landcover classes:

7

Dominant landcover type:

80: Tree cover, needleleaved, deciduous, closed to open (>15%)

Fraction of dominant landcover type [%]:

52.0


Radius: 5 km

Number of landcover classes:

11

Dominant landcover type:

80: Tree cover, needleleaved, deciduous, closed to open (>15%)

Fraction of dominant landcover type [%]:

35.0


Radius: 10 km

Number of landcover classes:

9

Dominant landcover type:

80: Tree cover, needleleaved, deciduous, closed to open (>15%)

Fraction of dominant landcover type [%]:

29.0


Radius: 20 km

Number of landcover classes:

8

Dominant landcover type:

70: Tree cover, needleleaved, evergreen, closed to open (>15%)

Fraction of dominant landcover type [%]:

35.0


Disturbances


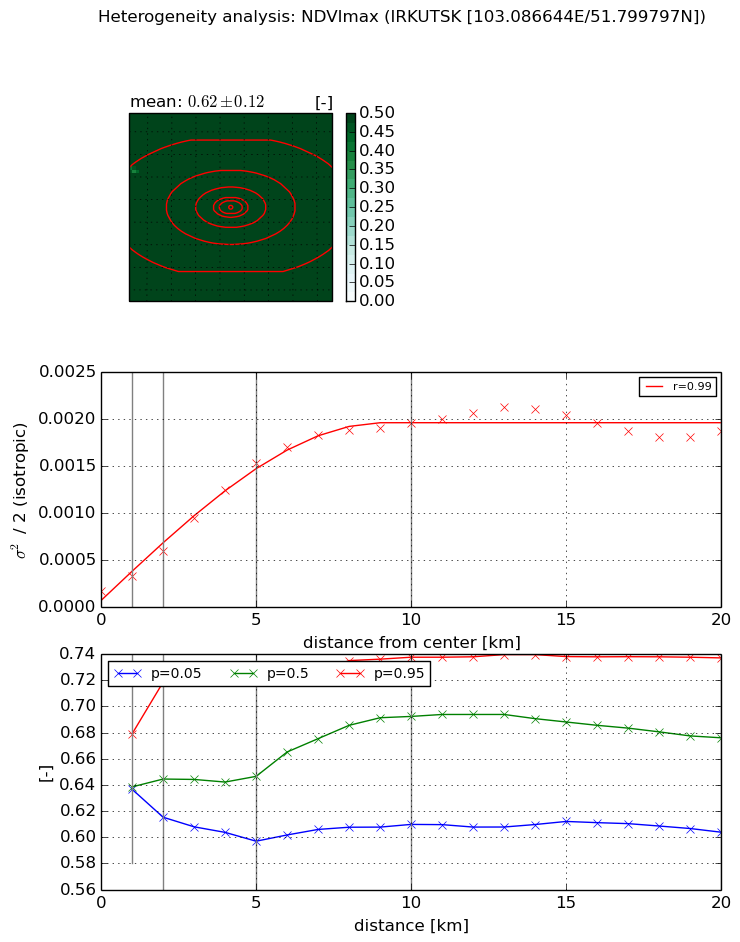
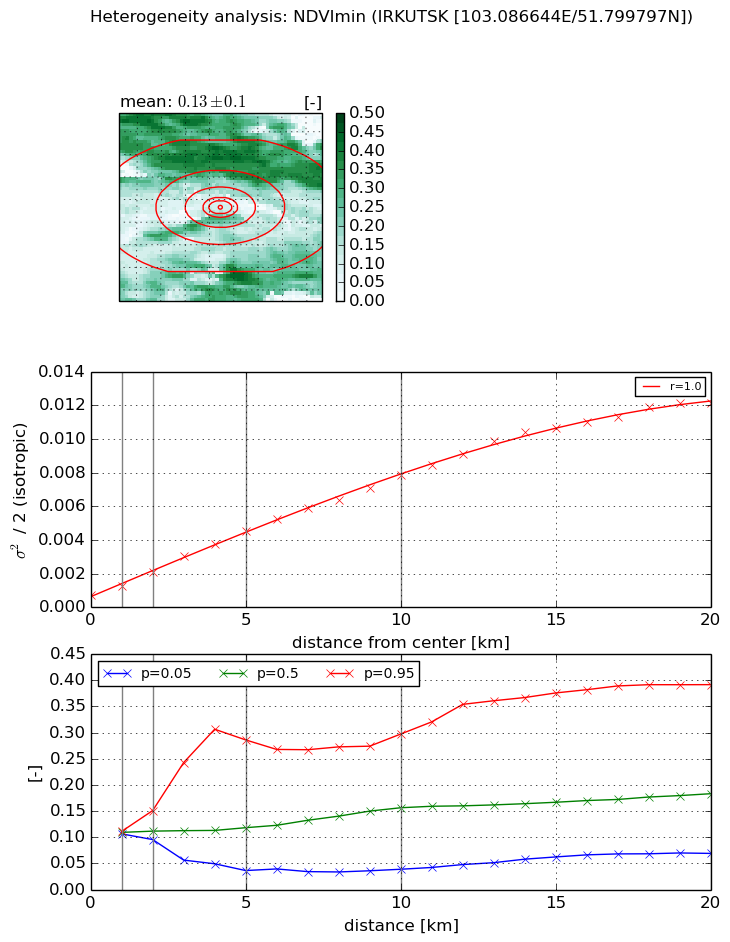
Heterogeneity analysis

The heterogeneity analysis provides information about the spatial and temporal heterogeneity of the site.

Topography


Roman et al. (2009) index


St

1.06507421034

Rcv

0.315787242192

Rse

0.0

Rst

6.43283207165e-07

Rsv

2.50091725195


Height range @ 1km [m]

18

Height range @ 2km [m]

109

Height range @ 5km [m]

194

Height range @ 10km [m]

-999

Height range @ 20km [m]

-999


Variance slope @ 1 km

886

Variance slope @ 2 km

1027

Variance slope @ 5 km

1454

Variance slope @ 10 km

-999

Variance slope @ 20 km

-999


NDVI (max. NDVI composite)


Roman et al. (2009) index


St

3.10481784431

Rcv

0.0847805356068

Rse

0.0

Rst

-0.131476518652

Rsv

0.749983205375


NDVI range @ 1km [-]

0.04

NDVI range @ 2km [-]

0.1

NDVI range @ 5km [-]

0.12

NDVI range @ 10km [-]

0.13

NDVI range @ 20km [-]

0.13


Variance slope @ 1 km

0.000159372339184

Variance slope @ 2 km

0.0002175619371

Variance slope @ 5 km

0.000282747280102

Variance slope @ 10 km

0.000193931315017

Variance slope @ 20 km

7.32310544037e-05


NDVI (min. NDVI composite)I


Roman et al. (2009) index


St

6.74576959085

Rcv

0.31415059495

Rse

0.0

Rst

-0.0128732455536

Rsv

0.117699324081


NDVI range @ 1km [-]

0.0

NDVI range @ 2km [-]

0.06

NDVI range @ 5km [-]

0.25

NDVI range @ 10km [-]

0.26

NDVI range @ 20km [-]

0.32


NDVI slope @ 1 km

0.000547088806264

NDVI slope @ 2 km

0.000688272943938

NDVI slope @ 5 km

0.000786341608517

NDVI slope @ 10 km

0.000719011123571

NDVI slope @ 20 km

0.000598995168796


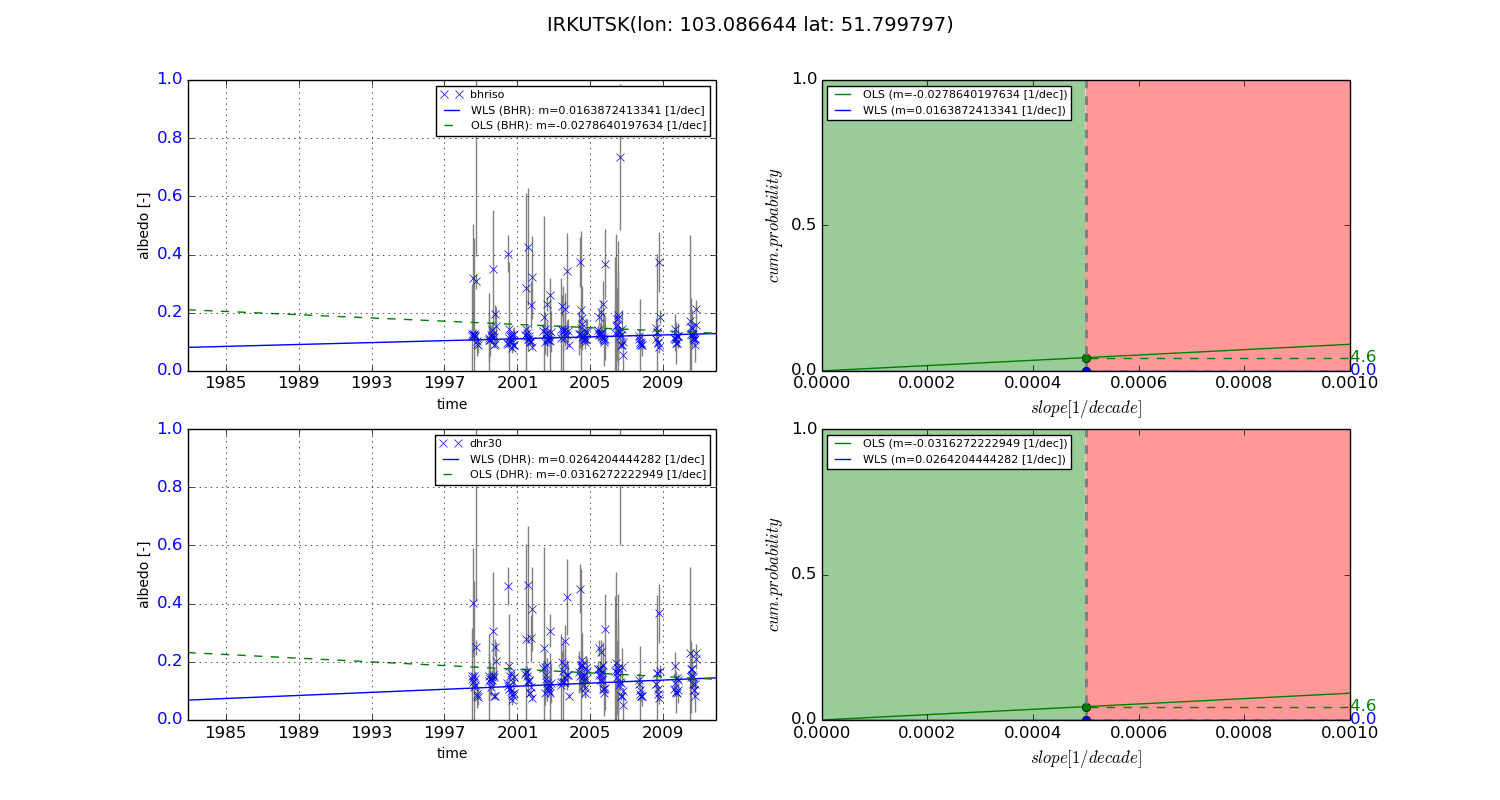
Temporal stability analysis

+000 deg (BHR)


BHR statistics

Temporal stability [1/decade]:


abs

rel


Weighted least square:

None


Ordinary least square:

None


Probabilities that GCOS criteria is met:

Weighted least square:

None %

Ordinary least square:

None %


DHR statistics

Temporal stability [1/decade]:


abs

rel


Weighted least square:

None


Ordinary least square:

None


Probabilities that GCOS criteria is met:

Weighted least square:

None %

Ordinary least square:

None %


+057/+063 deg (BHR)


BHR statistics

Temporal stability [1/decade]:


abs

rel


Weighted least square:

0.0163872413341


Ordinary least square:

-0.0278640197634


Probabilities that GCOS criteria is met:

Weighted least square:

0.0 %

Ordinary least square:

4.6 %


DHR statistics

Temporal stability [1/decade]:


abs

rel


Weighted least square:

0.0264204444282


Ordinary least square:

-0.0316272222949


Probabilities that GCOS criteria is met:

Weighted least square:

0.0 %

Ordinary least square:

4.6 %


Temporal anomaly analyis

The variance of the temporal anomalies provides an additional measure about the stability of the signal AFTER removal of the mean seasonal cylce.

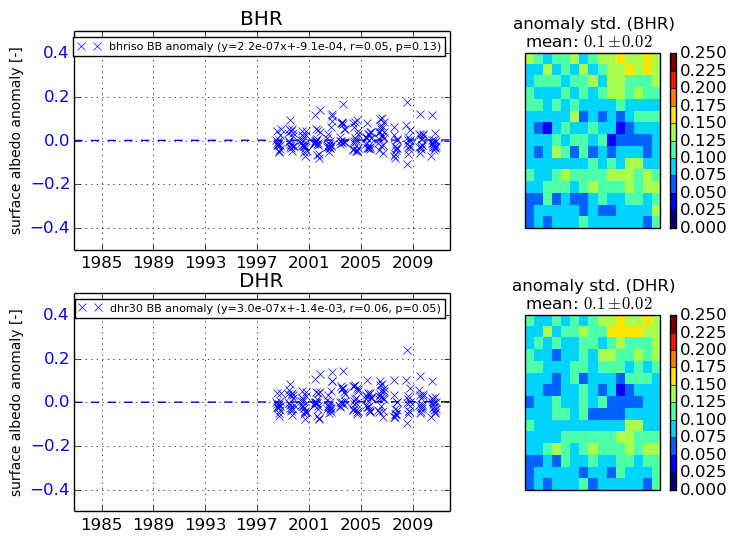
+000 deg


+057/+063 deg