ISSYK-KUL


Location

lon / lat [deg]: 76.9831 / 42.6228

Source network: AERONET


Geostationary surface albedo (GSA) data


“+000”


“+057/+063”


Landcover information (based on ESA CCI landcover data)


Landcover fractions @ 2km distance


Landcover fractions @ 20 km distance


Legend


Distance to open water bodies [km]:

1.15

Distance to urban areas [km]:

0.38


Radius: 1 km

Number of landcover classes:

4

Dominant landcover type:

190: urban areas

Fraction of dominant landcover type [%]:

35.0


Radius: 2 km

Number of landcover classes:

6

Dominant landcover type:

130: grassland

Fraction of dominant landcover type [%]:

30.0


Radius: 5 km

Number of landcover classes:

6

Dominant landcover type:

130: grassland

Fraction of dominant landcover type [%]:

38.0


Radius: 10 km

Number of landcover classes:

8

Dominant landcover type:

210: water bodies

Fraction of dominant landcover type [%]:

43.0


Radius: 20 km

Number of landcover classes:

9

Dominant landcover type:

210: water bodies

Fraction of dominant landcover type [%]:

47.0


Disturbances


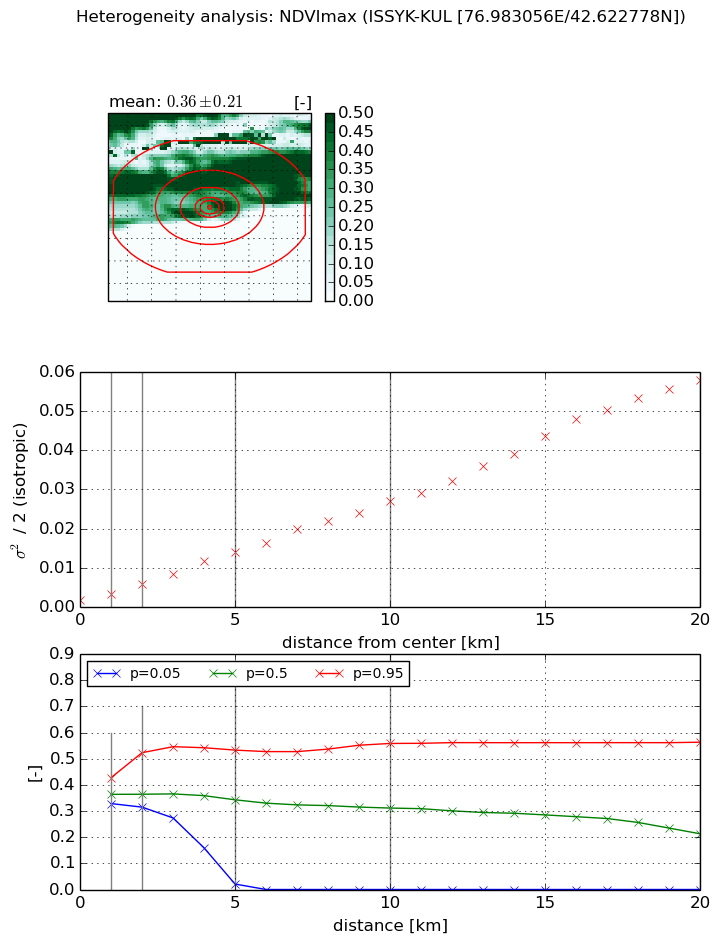
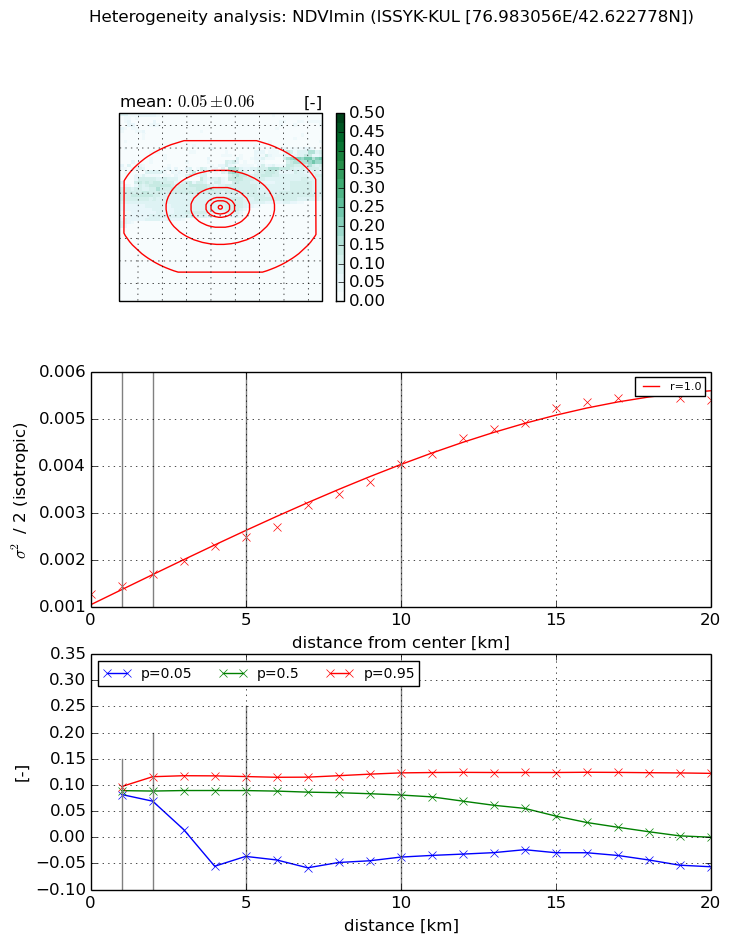
Heterogeneity analysis

The heterogeneity analysis provides information about the spatial and temporal heterogeneity of the site.

Topography


Roman et al. (2009) index


St

2.80279767393

Rcv

0.62520340414

Rse

0.0

Rst

-6.44433253438e-08

Rsv

-0.445155632932


Height range @ 1km [m]

0

Height range @ 2km [m]

104

Height range @ 5km [m]

248

Height range @ 10km [m]

-999

Height range @ 20km [m]

-999


Variance slope @ 1 km

755

Variance slope @ 2 km

1203

Variance slope @ 5 km

2136

Variance slope @ 10 km

-999

Variance slope @ 20 km

-999


NDVI (max. NDVI composite)


Roman et al. (2009) index


St

1.90142036643

Rcv

0.845634452955

Rse

0.0

Rst

-0.120204497834

Rsv

0.611928939446


NDVI range @ 1km [-]

0.1

NDVI range @ 2km [-]

0.21

NDVI range @ 5km [-]

0.51

NDVI range @ 10km [-]

0.56

NDVI range @ 20km [-]

0.56


Variance slope @ 1 km

0.00157008476945

Variance slope @ 2 km

0.0020479365438

Variance slope @ 5 km

0.00257451440085

Variance slope @ 10 km

0.00258458437005

Variance slope @ 20 km

0.00290440531519


NDVI (min. NDVI composite)I


Roman et al. (2009) index


St

1.74006980832

Rcv

1.0670724944

Rse

0.0

Rst

0.0130854212552

Rsv

0.643910846217


NDVI range @ 1km [-]

0.02

NDVI range @ 2km [-]

0.05

NDVI range @ 5km [-]

0.15

NDVI range @ 10km [-]

0.16

NDVI range @ 20km [-]

0.18


NDVI slope @ 1 km

0.000172418272269

NDVI slope @ 2 km

0.000216199866897

NDVI slope @ 5 km

0.000254710035664

NDVI slope @ 10 km

0.000278592391263

NDVI slope @ 20 km

0.000235429651345


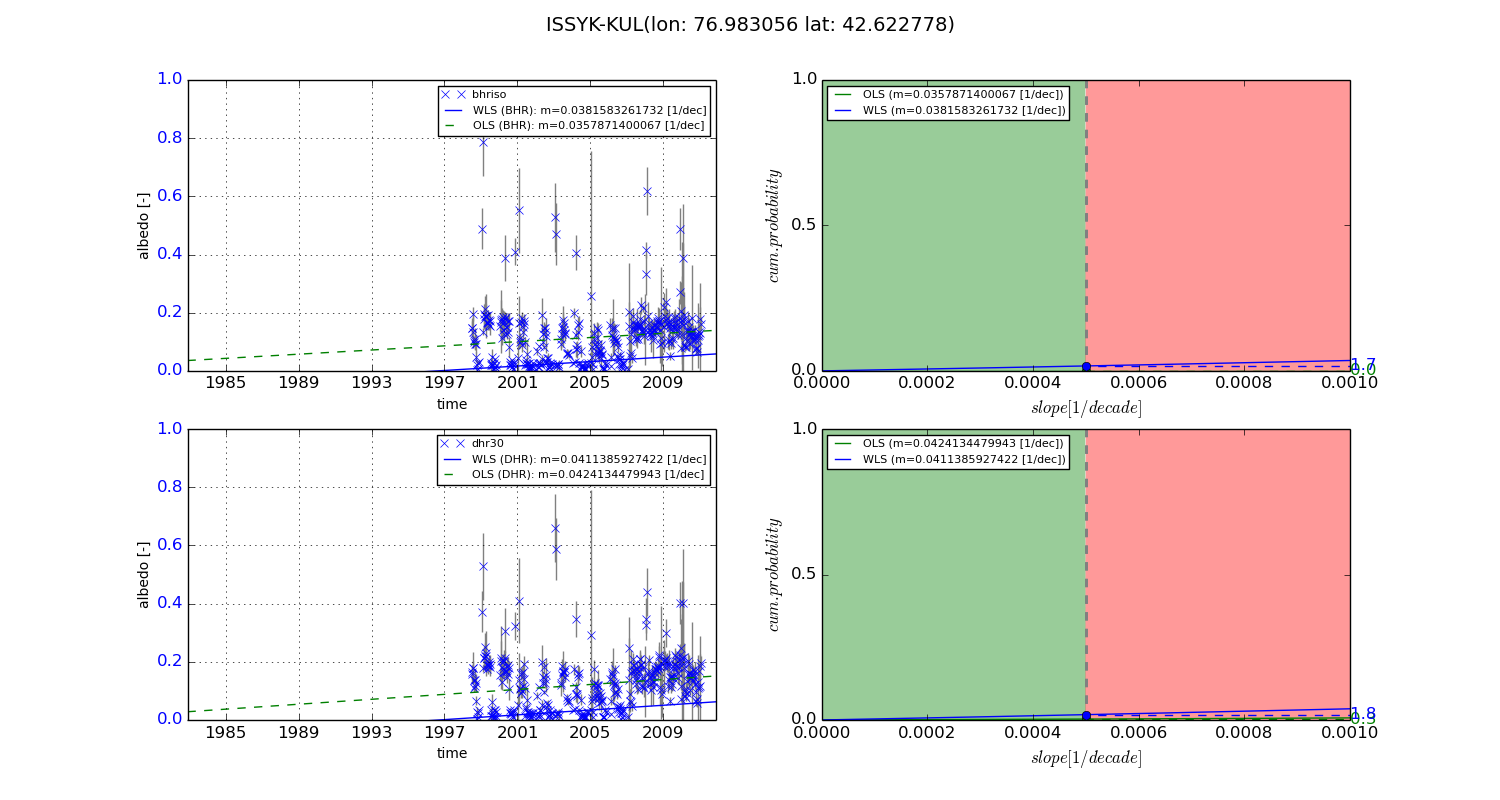
Temporal stability analysis

+000 deg (BHR)


BHR statistics

Temporal stability [1/decade]:


abs

rel


Weighted least square:

-99999.0


Ordinary least square:

-99999.0


Probabilities that GCOS criteria is met:

Weighted least square:

-99999.0 %

Ordinary least square:

-99999.0 %


DHR statistics

Temporal stability [1/decade]:


abs

rel


Weighted least square:

-99999.0


Ordinary least square:

-99999.0


Probabilities that GCOS criteria is met:

Weighted least square:

-99999.0 %

Ordinary least square:

-99999.0 %


+057/+063 deg (BHR)


BHR statistics

Temporal stability [1/decade]:


abs

rel


Weighted least square:

0.0381583261732


Ordinary least square:

0.0357871400067


Probabilities that GCOS criteria is met:

Weighted least square:

1.7 %

Ordinary least square:

0.0 %


DHR statistics

Temporal stability [1/decade]:


abs

rel


Weighted least square:

0.0411385927422


Ordinary least square:

0.0424134479943


Probabilities that GCOS criteria is met:

Weighted least square:

1.8 %

Ordinary least square:

0.3 %


Temporal anomaly analyis

The variance of the temporal anomalies provides an additional measure about the stability of the signal AFTER removal of the mean seasonal cylce.

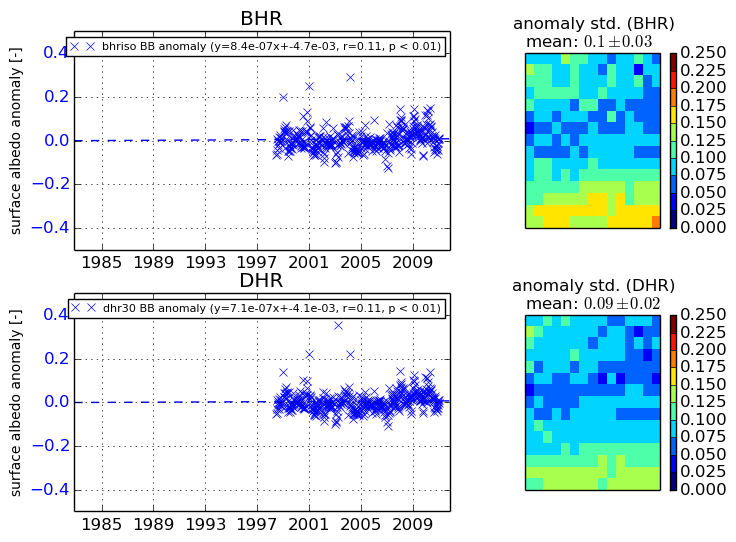
+000 deg


+057/+063 deg