IT-LEC


Location

lon / lat [deg]: 11.2706 / 43.3046

Source network: FLUXNET


Geostationary surface albedo (GSA) data


“+000”


“+057/+063”


Landcover information (based on ESA CCI landcover data)


Landcover fractions @ 2km distance


Landcover fractions @ 20 km distance


Legend


Distance to open water bodies [km]:

31.18

Distance to urban areas [km]:

1.91


Radius: 1 km

Number of landcover classes:

3

Dominant landcover type:

60: Tree cover, broadleaved, decidous

Fraction of dominant landcover type [%]:

71.0


Radius: 2 km

Number of landcover classes:

4

Dominant landcover type:

60: Tree cover, broadleaved, decidous

Fraction of dominant landcover type [%]:

51.0


Radius: 5 km

Number of landcover classes:

5

Dominant landcover type:

10: cropland, rainfed

Fraction of dominant landcover type [%]:

65.0


Radius: 10 km

Number of landcover classes:

5

Dominant landcover type:

10: cropland, rainfed

Fraction of dominant landcover type [%]:

57.0


Radius: 20 km

Number of landcover classes:

10

Dominant landcover type:

10: cropland, rainfed

Fraction of dominant landcover type [%]:

55.0


Disturbances


Heterogeneity analysis

The heterogeneity analysis provides information about the spatial and temporal heterogeneity of the site.

Topography


Roman et al. (2009) index


St

4.4109226743

Rcv

0.0467380751085

Rse

0.0

Rst

-0.0815184087335

Rsv

0.551873326068


Height range @ 1km [m]

109

Height range @ 2km [m]

162

Height range @ 5km [m]

153

Height range @ 10km [m]

-999

Height range @ 20km [m]

-999


Variance slope @ 1 km

783

Variance slope @ 2 km

784

Variance slope @ 5 km

600

Variance slope @ 10 km

-999

Variance slope @ 20 km

-999


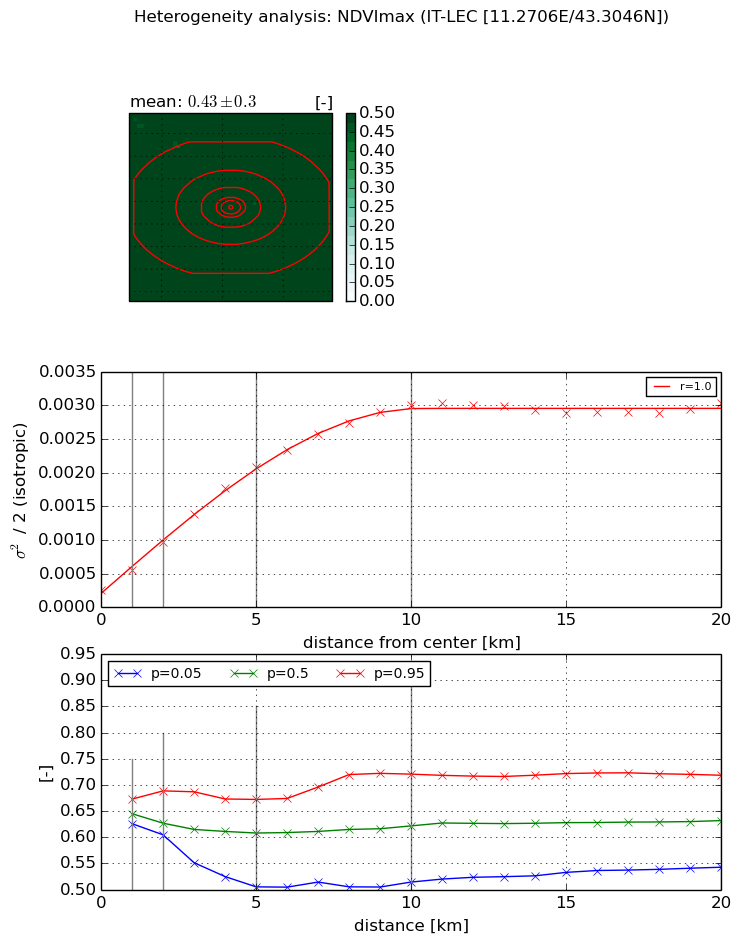
NDVI (max. NDVI composite)


Roman et al. (2009) index


St

3.1007731208

Rcv

0.317737732896

Rse

0.0

Rst

-0.0483189567286

Rsv

0.60144395719


NDVI range @ 1km [-]

0.05

NDVI range @ 2km [-]

0.08

NDVI range @ 5km [-]

0.17

NDVI range @ 10km [-]

0.21

NDVI range @ 20km [-]

0.18


Variance slope @ 1 km

0.000295271724942

Variance slope @ 2 km

0.000361988676089

Variance slope @ 5 km

0.000377411659433

Variance slope @ 10 km

0.000286313745815

Variance slope @ 20 km

0.000117595415549


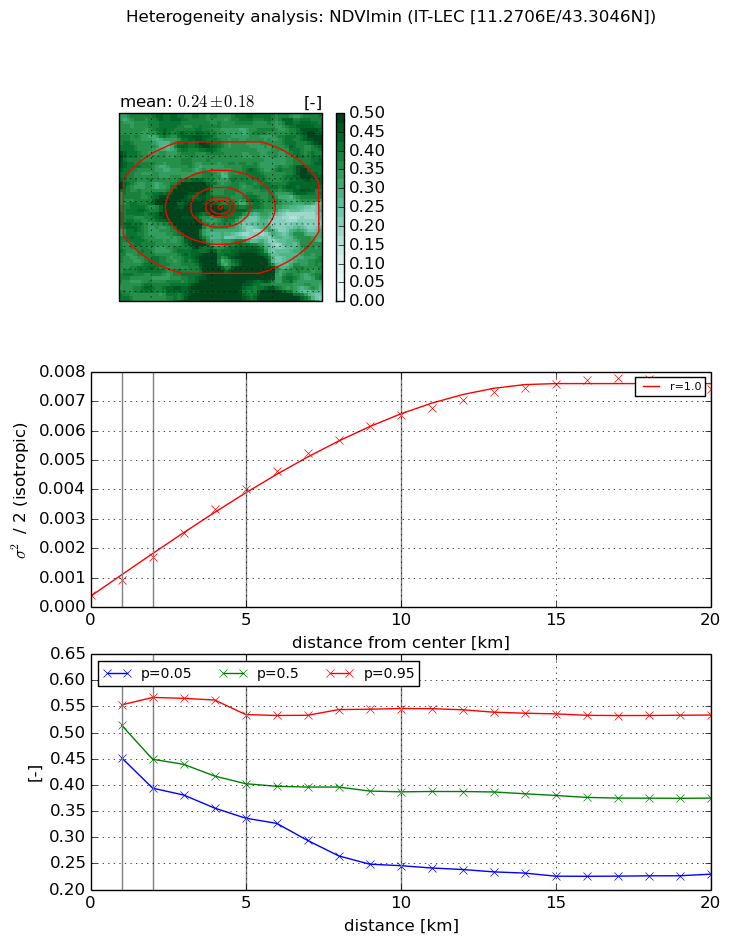
NDVI (min. NDVI composite)I


Roman et al. (2009) index


St

4.92420244345

Rcv

0.0368616904051

Rse

0.0

Rst

-0.0965561105793

Rsv

0.475817914739


NDVI range @ 1km [-]

0.1

NDVI range @ 2km [-]

0.17

NDVI range @ 5km [-]

0.2

NDVI range @ 10km [-]

0.3

NDVI range @ 20km [-]

0.3


NDVI slope @ 1 km

0.000512245611176

NDVI slope @ 2 km

0.000658786229811

NDVI slope @ 5 km

0.00074904146689

NDVI slope @ 10 km

0.000638070169315

NDVI slope @ 20 km

0.000364670973376


Temporal stability analysis

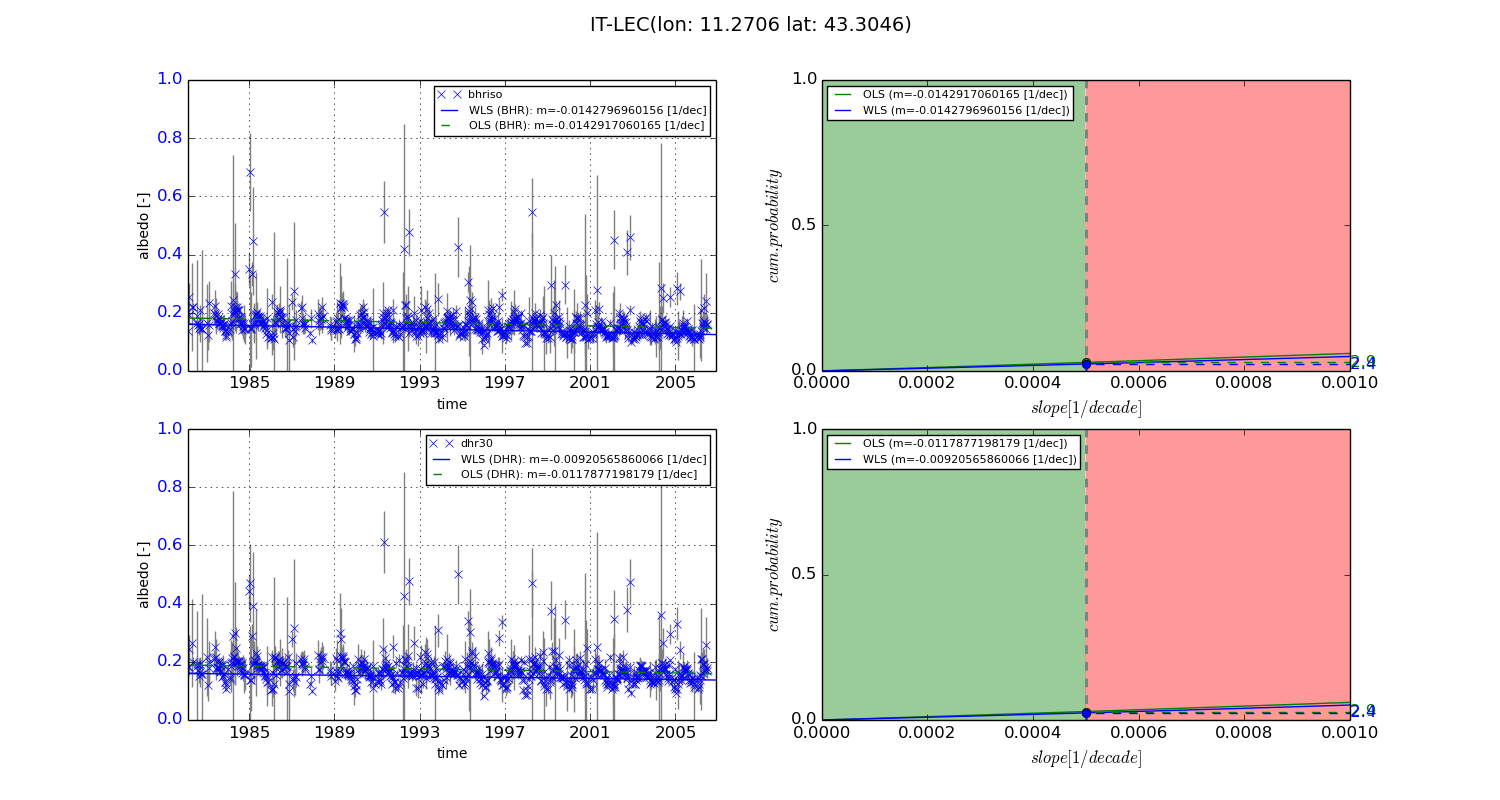
+000 deg (BHR)


BHR statistics

Temporal stability [1/decade]:


abs

rel


Weighted least square:

-0.0142796960156


Ordinary least square:

-0.0142917060165


Probabilities that GCOS criteria is met:

Weighted least square:

2.4 %

Ordinary least square:

2.9 %


DHR statistics

Temporal stability [1/decade]:


abs

rel


Weighted least square:

-0.00920565860066


Ordinary least square:

-0.0117877198179


Probabilities that GCOS criteria is met:

Weighted least square:

2.4 %

Ordinary least square:

2.9 %


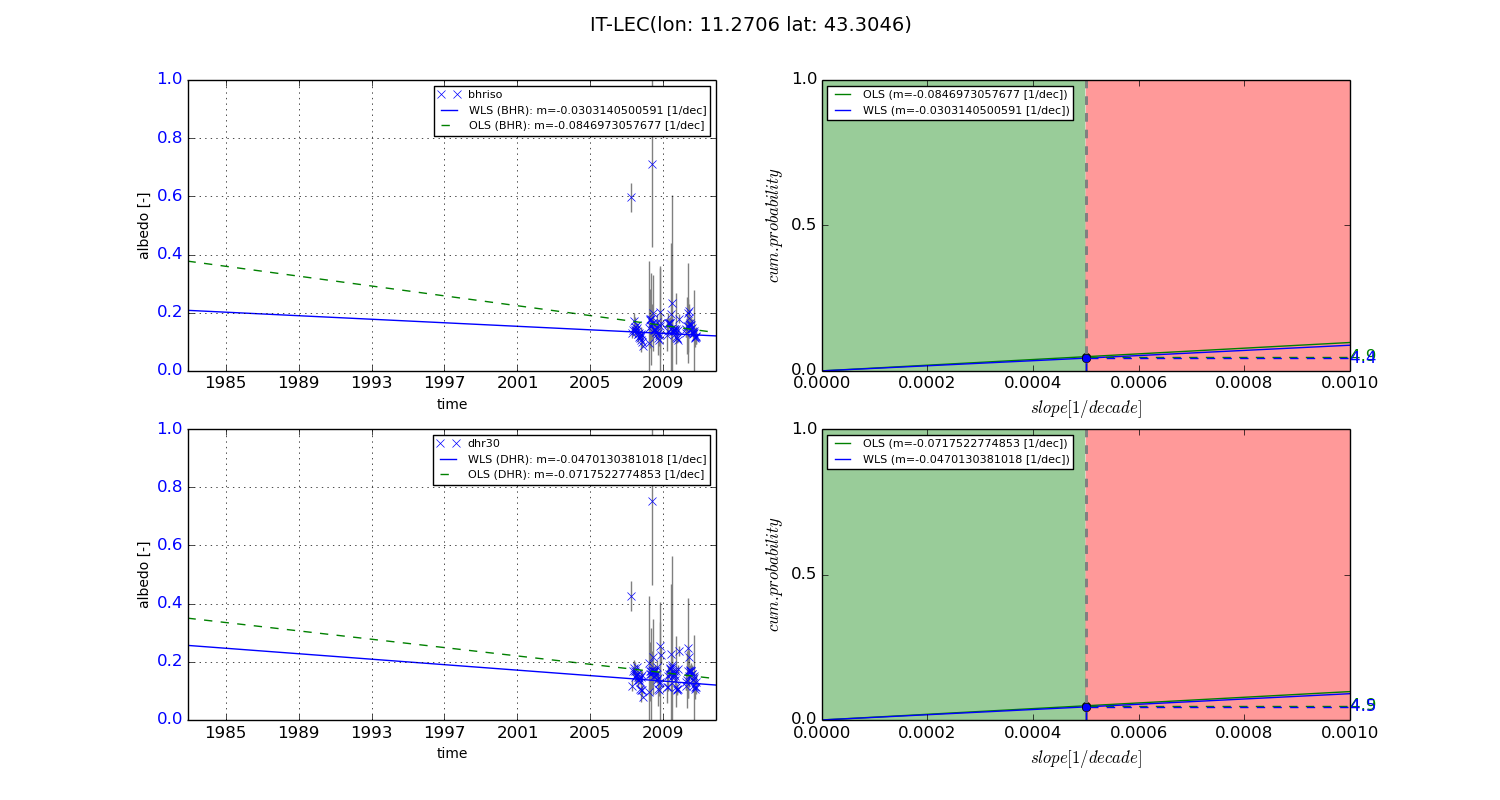
+057/+063 deg (BHR)


BHR statistics

Temporal stability [1/decade]:


abs

rel


Weighted least square:

-0.0303140500591


Ordinary least square:

-0.0846973057677


Probabilities that GCOS criteria is met:

Weighted least square:

4.4 %

Ordinary least square:

4.9 %


DHR statistics

Temporal stability [1/decade]:


abs

rel


Weighted least square:

-0.0470130381018


Ordinary least square:

-0.0717522774853


Probabilities that GCOS criteria is met:

Weighted least square:

4.5 %

Ordinary least square:

4.9 %


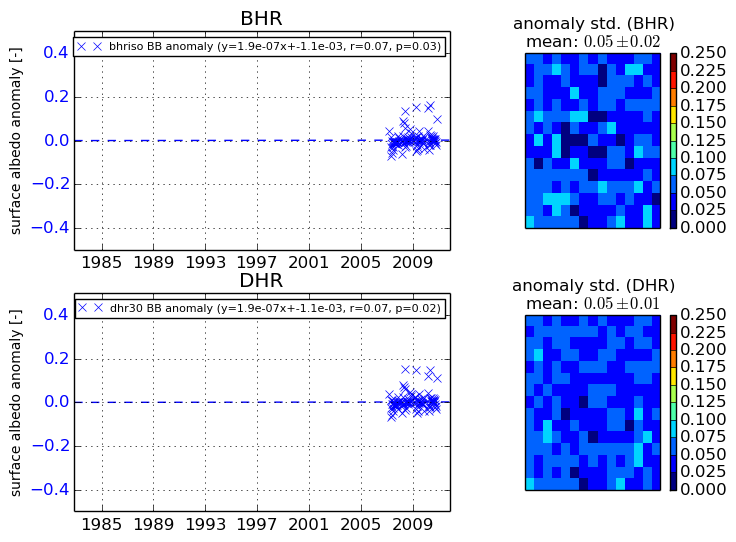
Temporal anomaly analyis

The variance of the temporal anomalies provides an additional measure about the stability of the signal AFTER removal of the mean seasonal cylce.
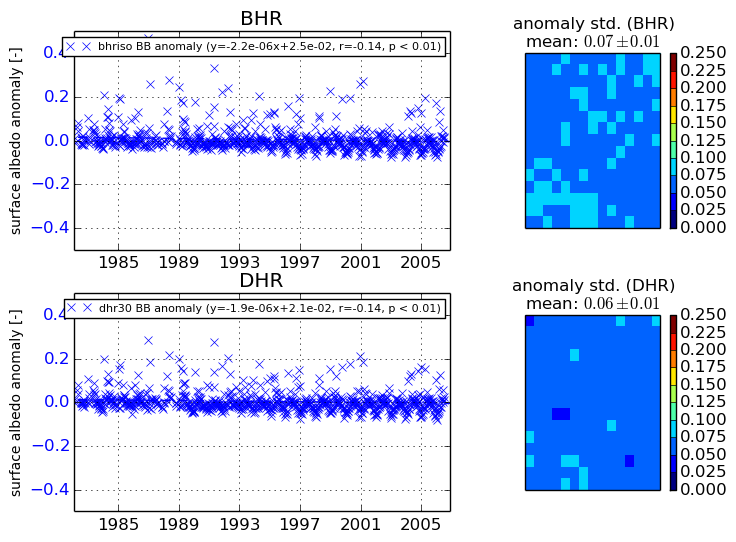
+000 deg


+057/+063 deg