IT-LMA


Location

lon / lat [deg]: 7.1546 / 45.5813

Source network: FLUXNET


Geostationary surface albedo (GSA) data


“+000”


“+057/+063”


Landcover information (based on ESA CCI landcover data)


Landcover fractions @ 2km distance


Landcover fractions @ 20 km distance


Legend


Distance to open water bodies [km]:

0.46

Distance to urban areas [km]:

13.33


Radius: 1 km

Number of landcover classes:

5

Dominant landcover type:

10: cropland, rainfed

Fraction of dominant landcover type [%]:

51.0


Radius: 2 km

Number of landcover classes:

6

Dominant landcover type:

200: bare areas

Fraction of dominant landcover type [%]:

29.0


Radius: 5 km

Number of landcover classes:

6

Dominant landcover type:

130: grassland

Fraction of dominant landcover type [%]:

26.0


Radius: 10 km

Number of landcover classes:

6

Dominant landcover type:

130: grassland

Fraction of dominant landcover type [%]:

25.0


Radius: 20 km

Number of landcover classes:

8

Dominant landcover type:

130: grassland

Fraction of dominant landcover type [%]:

22.0


Disturbances


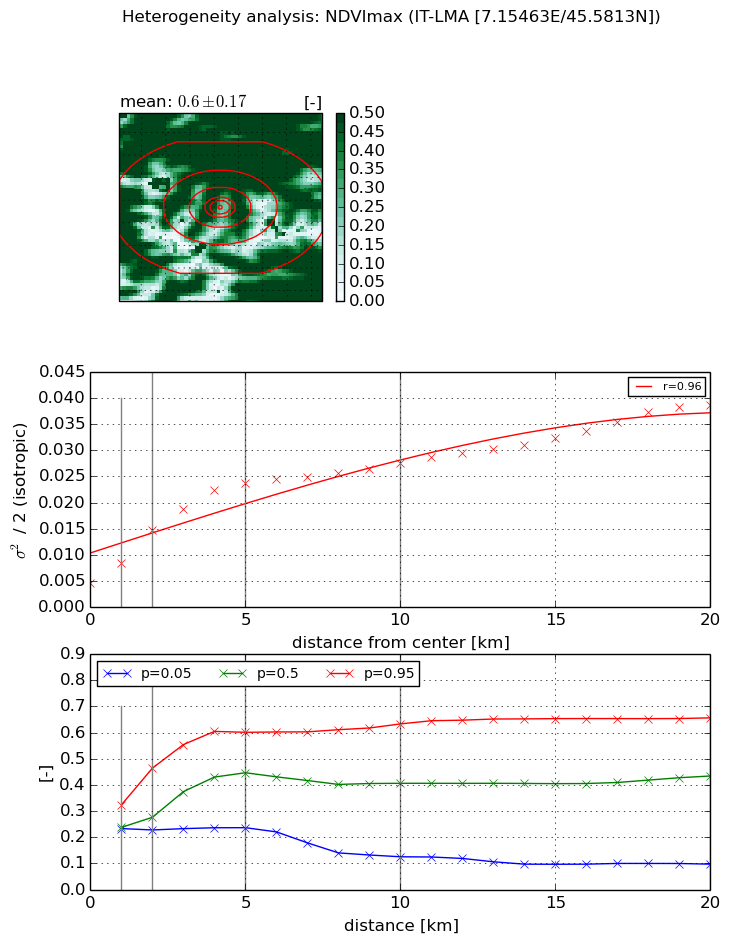
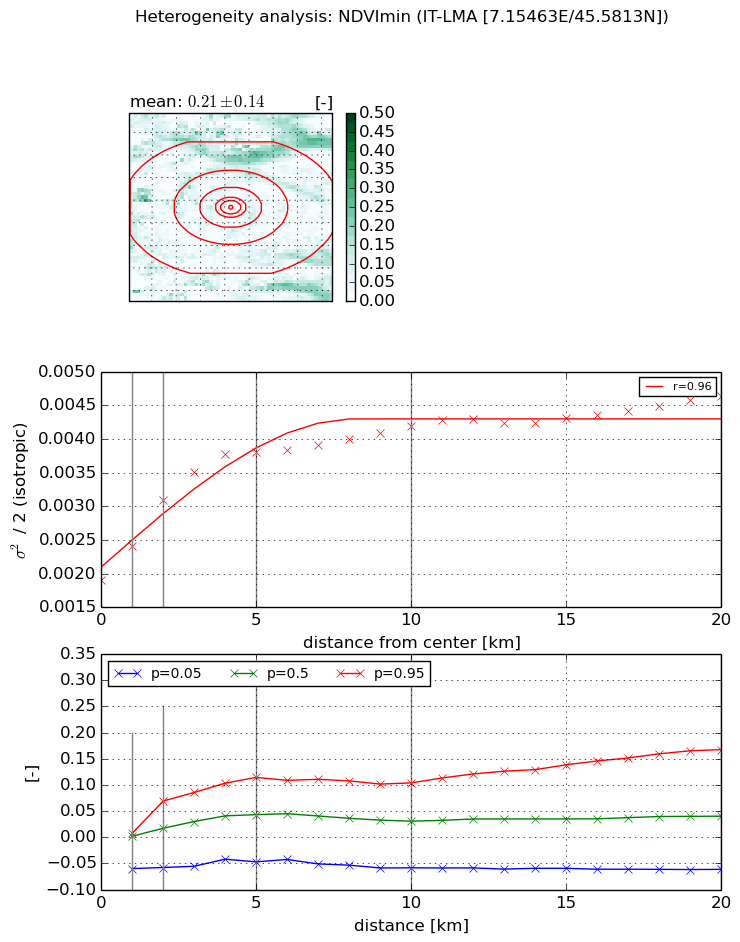
Heterogeneity analysis

The heterogeneity analysis provides information about the spatial and temporal heterogeneity of the site.

Topography


Roman et al. (2009) index


St

22.710606104

Rcv

0.0558418476345

Rse

0.0

Rst

0.00521795749562

Rsv

-0.0710370656562


Height range @ 1km [m]

962

Height range @ 2km [m]

1345

Height range @ 5km [m]

1415

Height range @ 10km [m]

-999

Height range @ 20km [m]

-999


Variance slope @ 1 km

68432

Variance slope @ 2 km

86827

Variance slope @ 5 km

54021

Variance slope @ 10 km

-999

Variance slope @ 20 km

-999


NDVI (max. NDVI composite)


Roman et al. (2009) index


St

3.58778276368

Rcv

-0.101064780881

Rse

0.0

Rst

-0.206548001468

Rsv

0.528558245163


NDVI range @ 1km [-]

0.09

NDVI range @ 2km [-]

0.24

NDVI range @ 5km [-]

0.36

NDVI range @ 10km [-]

0.51

NDVI range @ 20km [-]

0.56


Variance slope @ 1 km

0.00397489211234

Variance slope @ 2 km

0.00505352067798

Variance slope @ 5 km

0.00405137008884

Variance slope @ 10 km

0.00213083004774

Variance slope @ 20 km

0.00138992732178


NDVI (min. NDVI composite)I


Roman et al. (2009) index


St

1.99335922828

Rcv

-0.215131385659

Rse

0.0

Rst

-0.166972235136

Rsv

1.12289355053


NDVI range @ 1km [-]

0.07

NDVI range @ 2km [-]

0.13

NDVI range @ 5km [-]

0.16

NDVI range @ 10km [-]

0.16

NDVI range @ 20km [-]

0.23


NDVI slope @ 1 km

0.000520345212465

NDVI slope @ 2 km

0.00059677576038

NDVI slope @ 5 km

0.00040320107384

NDVI slope @ 10 km

0.000198560786072

NDVI slope @ 20 km

9.58302833524e-05


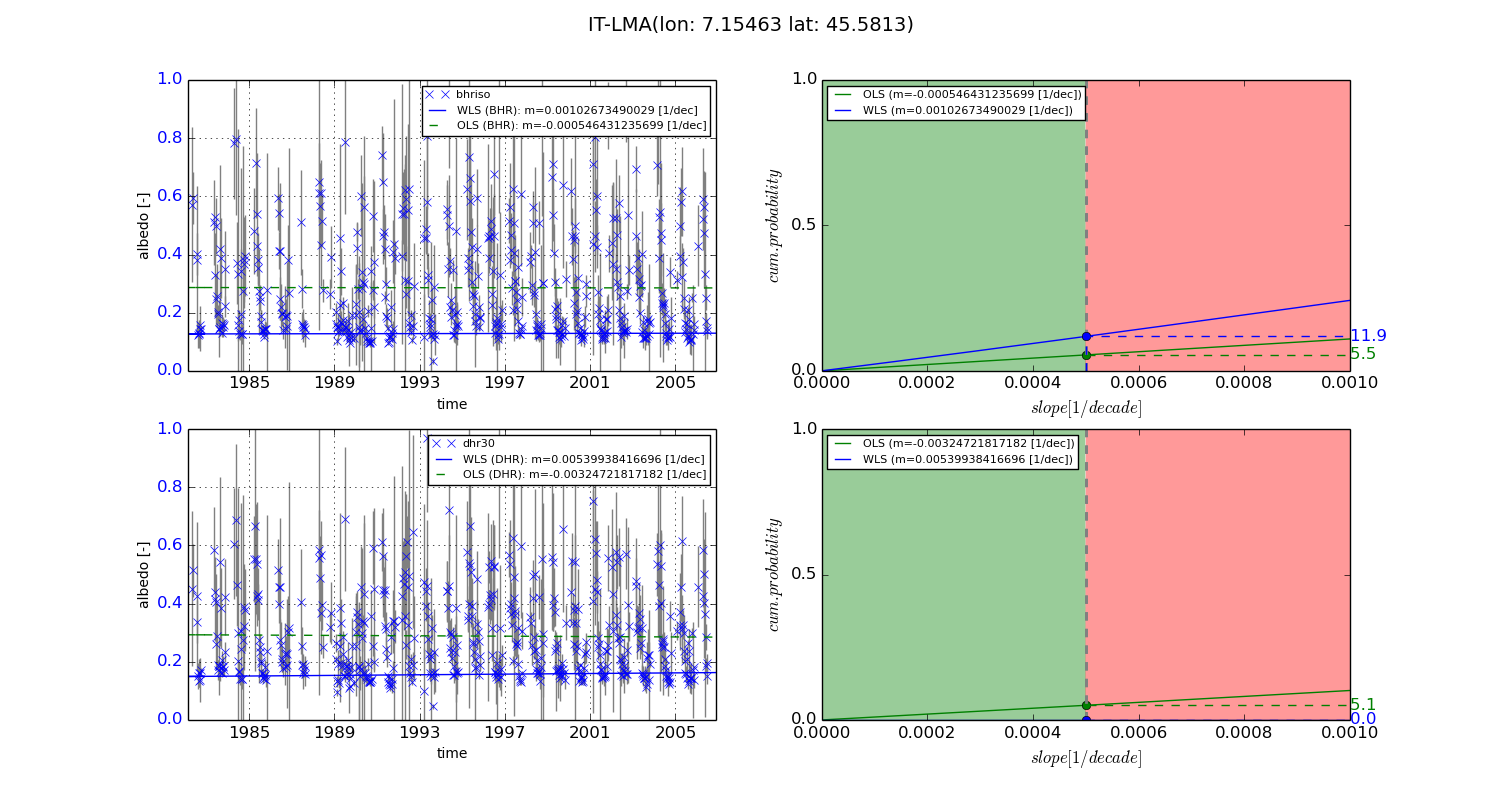
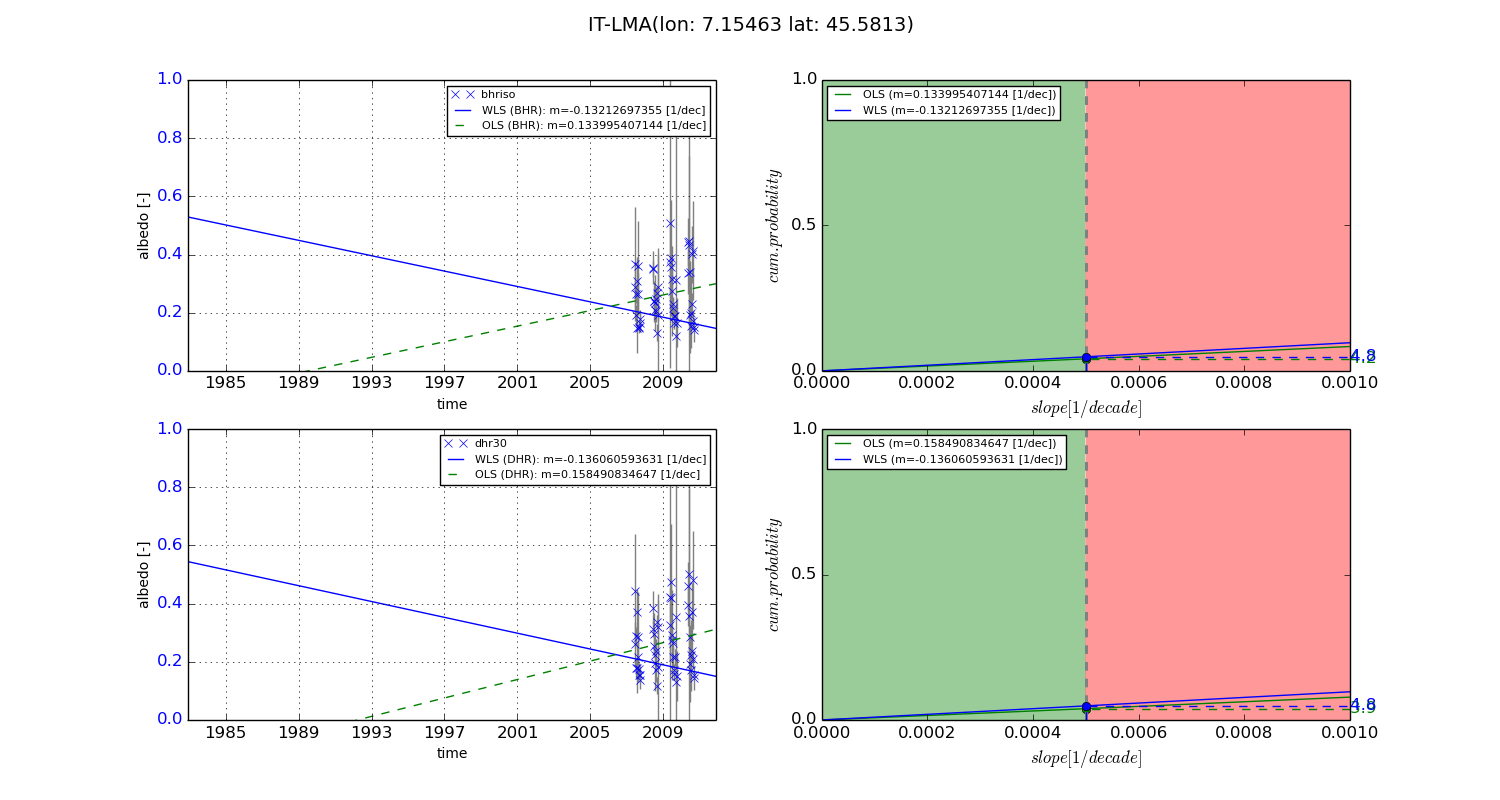
Temporal stability analysis

+000 deg (BHR)


BHR statistics

Temporal stability [1/decade]:


abs

rel


Weighted least square:

0.00102673490029


Ordinary least square:

-0.000546431235699


Probabilities that GCOS criteria is met:

Weighted least square:

11.9 %

Ordinary least square:

5.5 %


DHR statistics

Temporal stability [1/decade]:


abs

rel


Weighted least square:

0.00539938416696


Ordinary least square:

-0.00324721817182


Probabilities that GCOS criteria is met:

Weighted least square:

0.0 %

Ordinary least square:

5.1 %


+057/+063 deg (BHR)


BHR statistics

Temporal stability [1/decade]:


abs

rel


Weighted least square:

-0.13212697355


Ordinary least square:

0.133995407144


Probabilities that GCOS criteria is met:

Weighted least square:

4.8 %

Ordinary least square:

4.2 %


DHR statistics

Temporal stability [1/decade]:


abs

rel


Weighted least square:

-0.136060593631


Ordinary least square:

0.158490834647


Probabilities that GCOS criteria is met:

Weighted least square:

4.8 %

Ordinary least square:

3.9 %


Temporal anomaly analyis

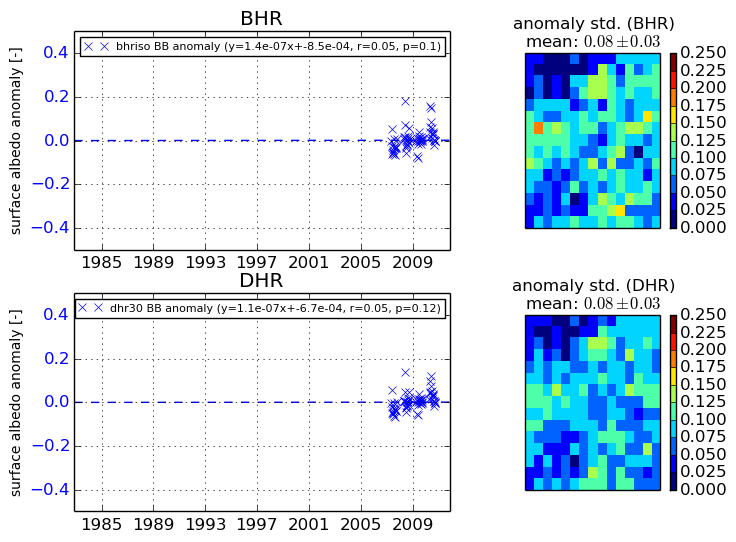
The variance of the temporal anomalies provides an additional measure about the stability of the signal AFTER removal of the mean seasonal cylce.
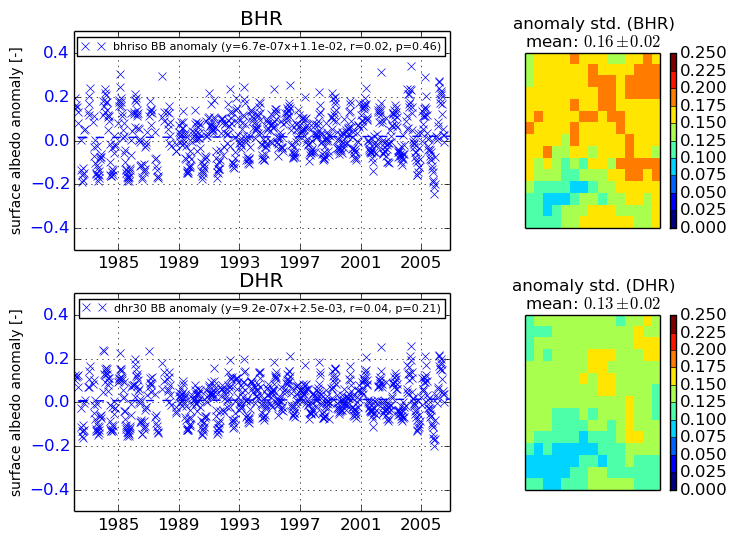
+000 deg


+057/+063 deg