IT-MAL


Location

lon / lat [deg]: 11.7028 / 46.1167

Source network: FLUXNET


Geostationary surface albedo (GSA) data


“+000”


“+057/+063”


Landcover information (based on ESA CCI landcover data)


Landcover fractions @ 2km distance


Landcover fractions @ 20 km distance


Legend


Distance to open water bodies [km]:

5.79

Distance to urban areas [km]:

4.33


Radius: 1 km

Number of landcover classes:

3

Dominant landcover type:

70: Tree cover, needleleaved, evergreen, closed to open (>15%)

Fraction of dominant landcover type [%]:

83.0


Radius: 2 km

Number of landcover classes:

6

Dominant landcover type:

70: Tree cover, needleleaved, evergreen, closed to open (>15%)

Fraction of dominant landcover type [%]:

73.0


Radius: 5 km

Number of landcover classes:

6

Dominant landcover type:

70: Tree cover, needleleaved, evergreen, closed to open (>15%)

Fraction of dominant landcover type [%]:

51.0


Radius: 10 km

Number of landcover classes:

8

Dominant landcover type:

70: Tree cover, needleleaved, evergreen, closed to open (>15%)

Fraction of dominant landcover type [%]:

45.0


Radius: 20 km

Number of landcover classes:

9

Dominant landcover type:

70: Tree cover, needleleaved, evergreen, closed to open (>15%)

Fraction of dominant landcover type [%]:

40.0


Disturbances


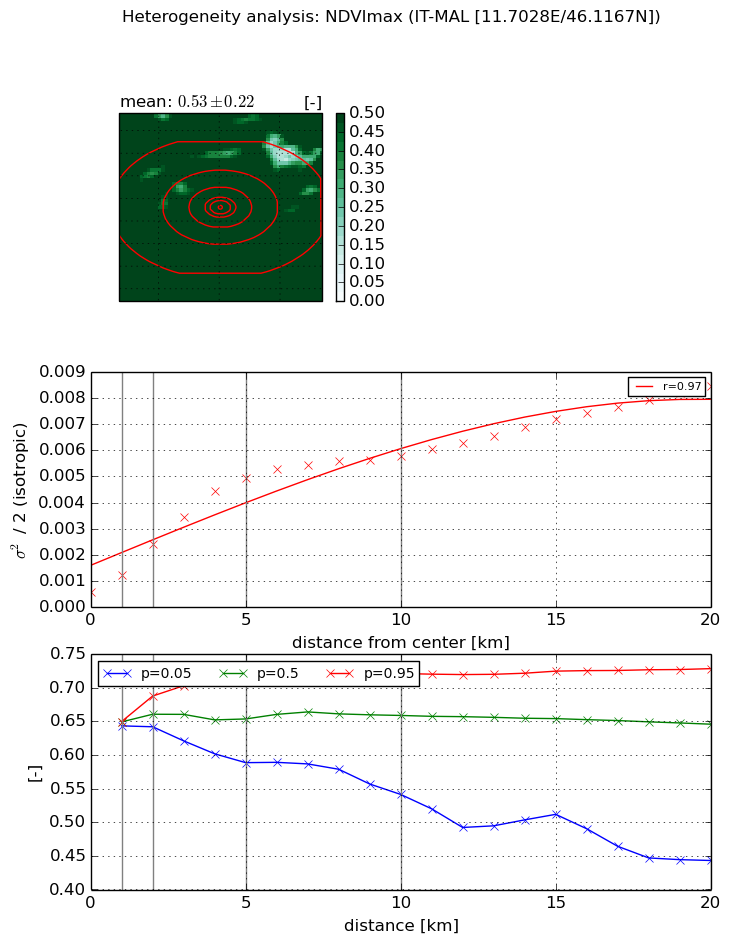
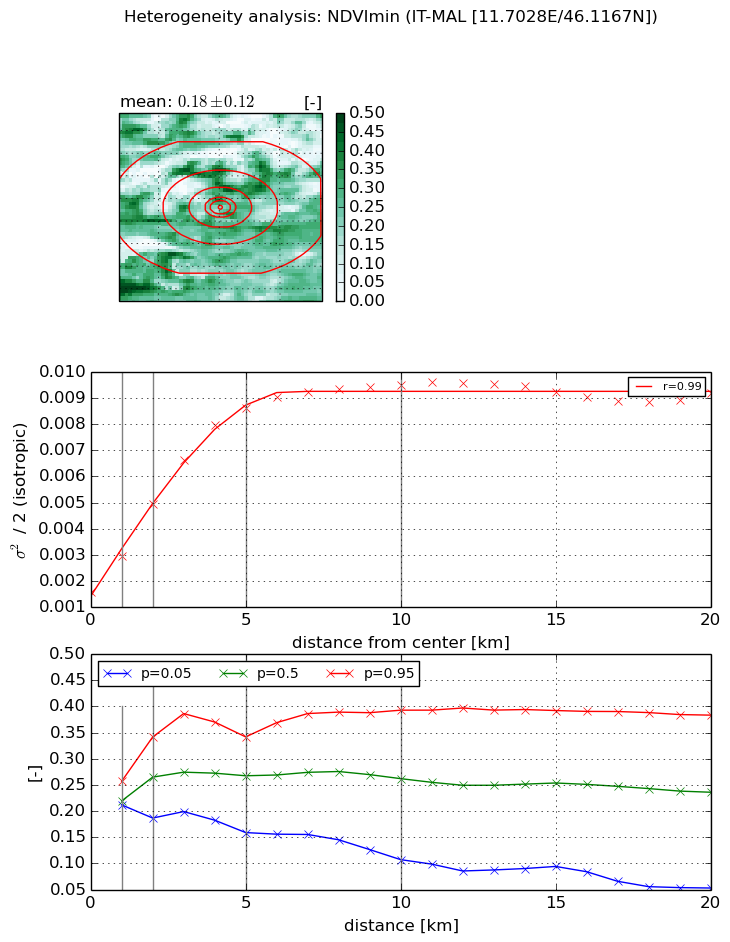
Heterogeneity analysis

The heterogeneity analysis provides information about the spatial and temporal heterogeneity of the site.

Topography


Roman et al. (2009) index


St

1.53627664167e-07

Rcv

0.31948865971

Rse

0.0

Rst

0.0114999763086

Rsv

19527732.6216


Height range @ 1km [m]

294

Height range @ 2km [m]

498

Height range @ 5km [m]

1263

Height range @ 10km [m]

-999

Height range @ 20km [m]

-999


Variance slope @ 1 km

41407

Variance slope @ 2 km

43948

Variance slope @ 5 km

31592

Variance slope @ 10 km

-999

Variance slope @ 20 km

-999


NDVI (max. NDVI composite)


Roman et al. (2009) index


St

0.00143940271906

Rcv

0.697311592333

Rse

0.0

Rst

8.9364911076e-06

Rsv

2083.50049311


NDVI range @ 1km [-]

0.01

NDVI range @ 2km [-]

0.05

NDVI range @ 5km [-]

0.15

NDVI range @ 10km [-]

0.18

NDVI range @ 20km [-]

0.29


Variance slope @ 1 km

0.000670548220289

Variance slope @ 2 km

0.000915927869392

Variance slope @ 5 km

0.000928866744926

Variance slope @ 10 km

0.000528149098515

Variance slope @ 20 km

0.000332327022094


NDVI (min. NDVI composite)I


Roman et al. (2009) index


St

10.0831021243

Rcv

0.11442708696

Rse

0.0

Rst

-0.0150304891585

Rsv

0.168069907292


NDVI range @ 1km [-]

0.05

NDVI range @ 2km [-]

0.16

NDVI range @ 5km [-]

0.18

NDVI range @ 10km [-]

0.29

NDVI range @ 20km [-]

0.33


NDVI slope @ 1 km

0.00136979664598

NDVI slope @ 2 km

0.00169060556185

NDVI slope @ 5 km

0.00148184712768

NDVI slope @ 10 km

0.000771547739583

NDVI slope @ 20 km

0.000245864035389


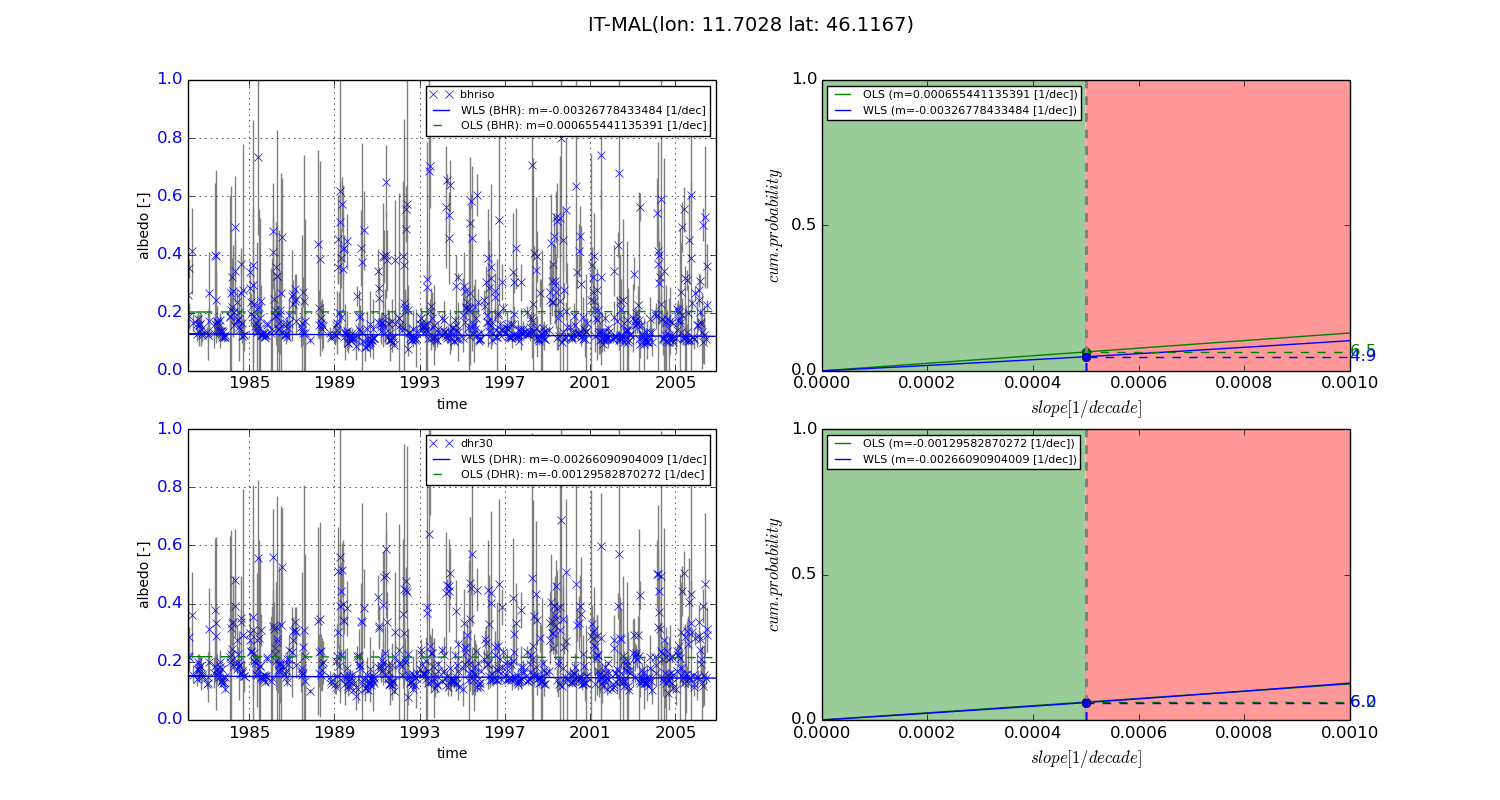
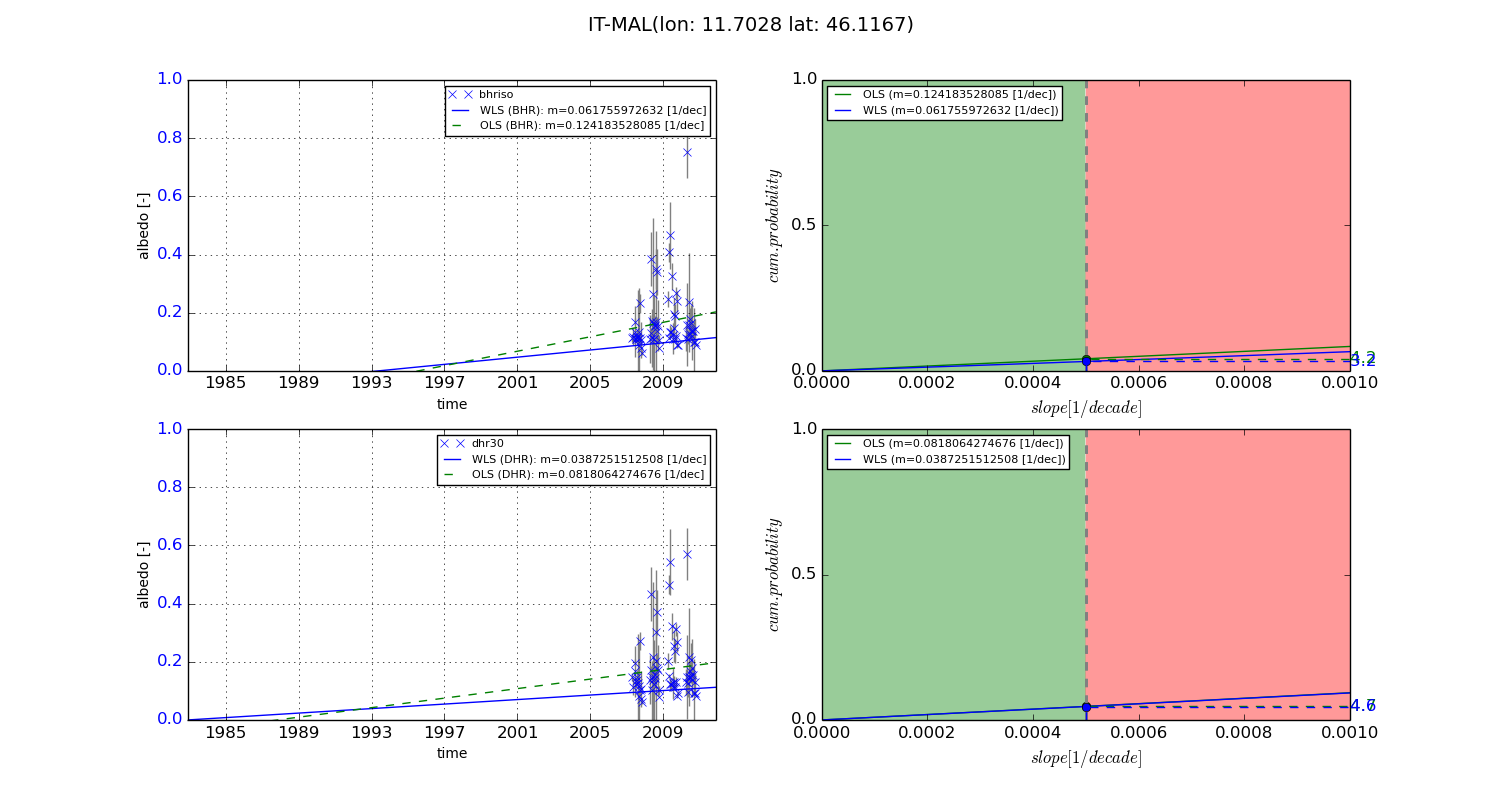
Temporal stability analysis

+000 deg (BHR)


BHR statistics

Temporal stability [1/decade]:


abs

rel


Weighted least square:

-0.00326778433484


Ordinary least square:

0.000655441135391


Probabilities that GCOS criteria is met:

Weighted least square:

4.9 %

Ordinary least square:

6.5 %


DHR statistics

Temporal stability [1/decade]:


abs

rel


Weighted least square:

-0.00266090904009


Ordinary least square:

-0.00129582870272


Probabilities that GCOS criteria is met:

Weighted least square:

6.0 %

Ordinary least square:

6.2 %


+057/+063 deg (BHR)


BHR statistics

Temporal stability [1/decade]:


abs

rel


Weighted least square:

0.061755972632


Ordinary least square:

0.124183528085


Probabilities that GCOS criteria is met:

Weighted least square:

3.2 %

Ordinary least square:

4.2 %


DHR statistics

Temporal stability [1/decade]:


abs

rel


Weighted least square:

0.0387251512508


Ordinary least square:

0.0818064274676


Probabilities that GCOS criteria is met:

Weighted least square:

4.6 %

Ordinary least square:

4.7 %


Temporal anomaly analyis

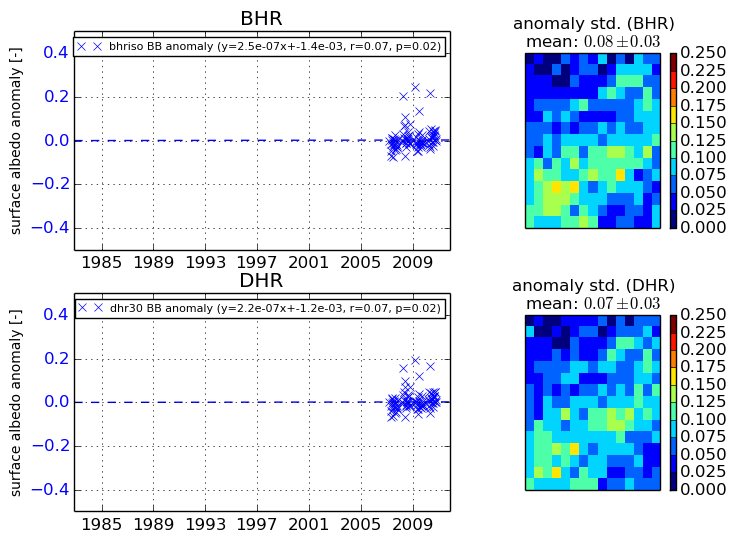
The variance of the temporal anomalies provides an additional measure about the stability of the signal AFTER removal of the mean seasonal cylce.
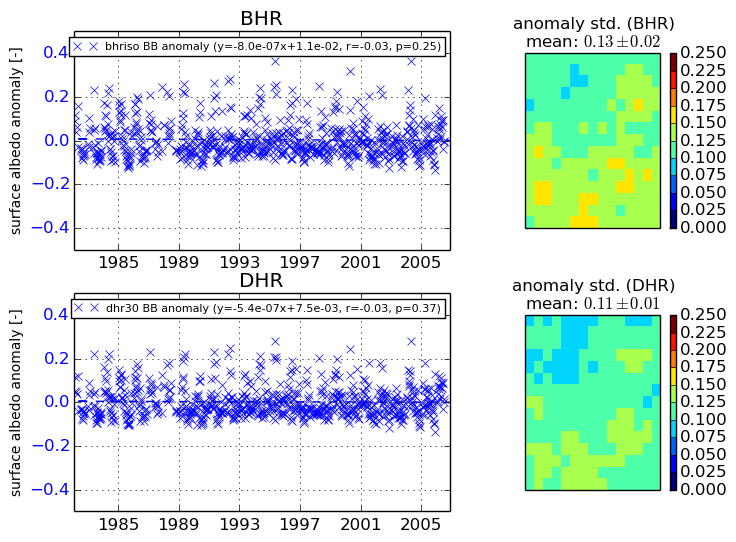
+000 deg


+057/+063 deg