IT-NON


Location

lon / lat [deg]: 11.0887 / 44.6898

Source network: FLUXNET


Geostationary surface albedo (GSA) data


“+000”


“+057/+063”


Landcover information (based on ESA CCI landcover data)


Landcover fractions @ 2km distance


Landcover fractions @ 20 km distance


Legend


Distance to open water bodies [km]:

0.43

Distance to urban areas [km]:

2.78


Radius: 1 km

Number of landcover classes:

3

Dominant landcover type:

10: cropland, rainfed

Fraction of dominant landcover type [%]:

82.0


Radius: 2 km

Number of landcover classes:

3

Dominant landcover type:

10: cropland, rainfed

Fraction of dominant landcover type [%]:

95.0


Radius: 5 km

Number of landcover classes:

2

Dominant landcover type:

10: cropland, rainfed

Fraction of dominant landcover type [%]:

91.0


Radius: 10 km

Number of landcover classes:

3

Dominant landcover type:

10: cropland, rainfed

Fraction of dominant landcover type [%]:

89.0


Radius: 20 km

Number of landcover classes:

3

Dominant landcover type:

10: cropland, rainfed

Fraction of dominant landcover type [%]:

83.0


Disturbances


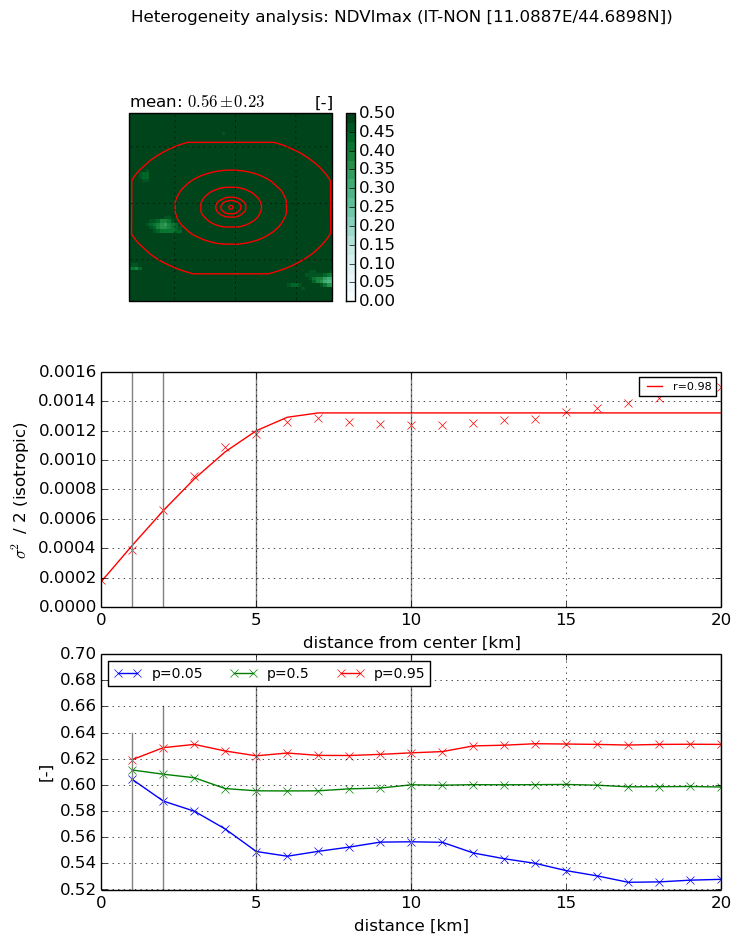
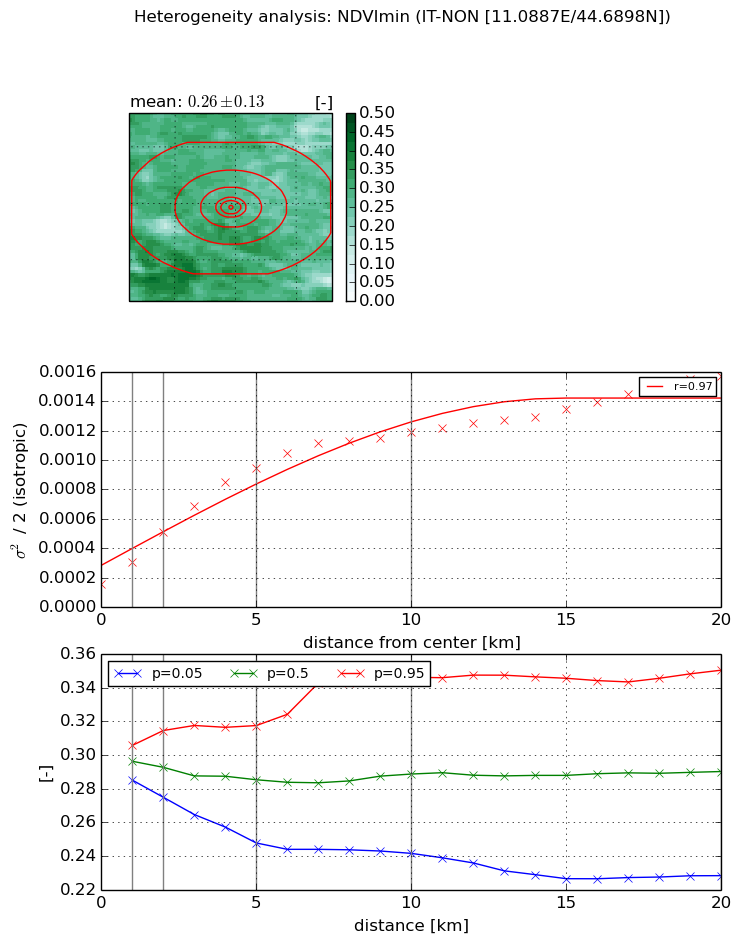
Heterogeneity analysis

The heterogeneity analysis provides information about the spatial and temporal heterogeneity of the site.

Topography


Roman et al. (2009) index


St

3.37195183078

Rcv

0.466025053856

Rse

0.0

Rst

0.0398798615221

Rsv

0.383787509234


Height range @ 1km [m]

4

Height range @ 2km [m]

4

Height range @ 5km [m]

8

Height range @ 10km [m]

-999

Height range @ 20km [m]

-999


Variance slope @ 1 km

1

Variance slope @ 2 km

1

Variance slope @ 5 km

1

Variance slope @ 10 km

-999

Variance slope @ 20 km

-999


NDVI (max. NDVI composite)


Roman et al. (2009) index


St

4.41577188123

Rcv

0.476303536724

Rse

0.0

Rst

-8.57517718112e-09

Rsv

0.203079375896


NDVI range @ 1km [-]

0.02

NDVI range @ 2km [-]

0.04

NDVI range @ 5km [-]

0.07

NDVI range @ 10km [-]

0.07

NDVI range @ 20km [-]

0.1


Variance slope @ 1 km

0.000198528972715

Variance slope @ 2 km

0.000235867338978

Variance slope @ 5 km

0.000208288958095

Variance slope @ 10 km

0.000104112990247

Variance slope @ 20 km

4.50595191803e-05


NDVI (min. NDVI composite)I


Roman et al. (2009) index


St

3.03529027421

Rcv

0.157405811284

Rse

0.0

Rst

-0.0568933009276

Rsv

0.774074232338


NDVI range @ 1km [-]

0.02

NDVI range @ 2km [-]

0.04

NDVI range @ 5km [-]

0.07

NDVI range @ 10km [-]

0.1

NDVI range @ 20km [-]

0.12


NDVI slope @ 1 km

0.00015221236522

NDVI slope @ 2 km

0.00017688340293

NDVI slope @ 5 km

0.000165120178285

NDVI slope @ 10 km

0.000104319873383

NDVI slope @ 20 km

5.93669738744e-05


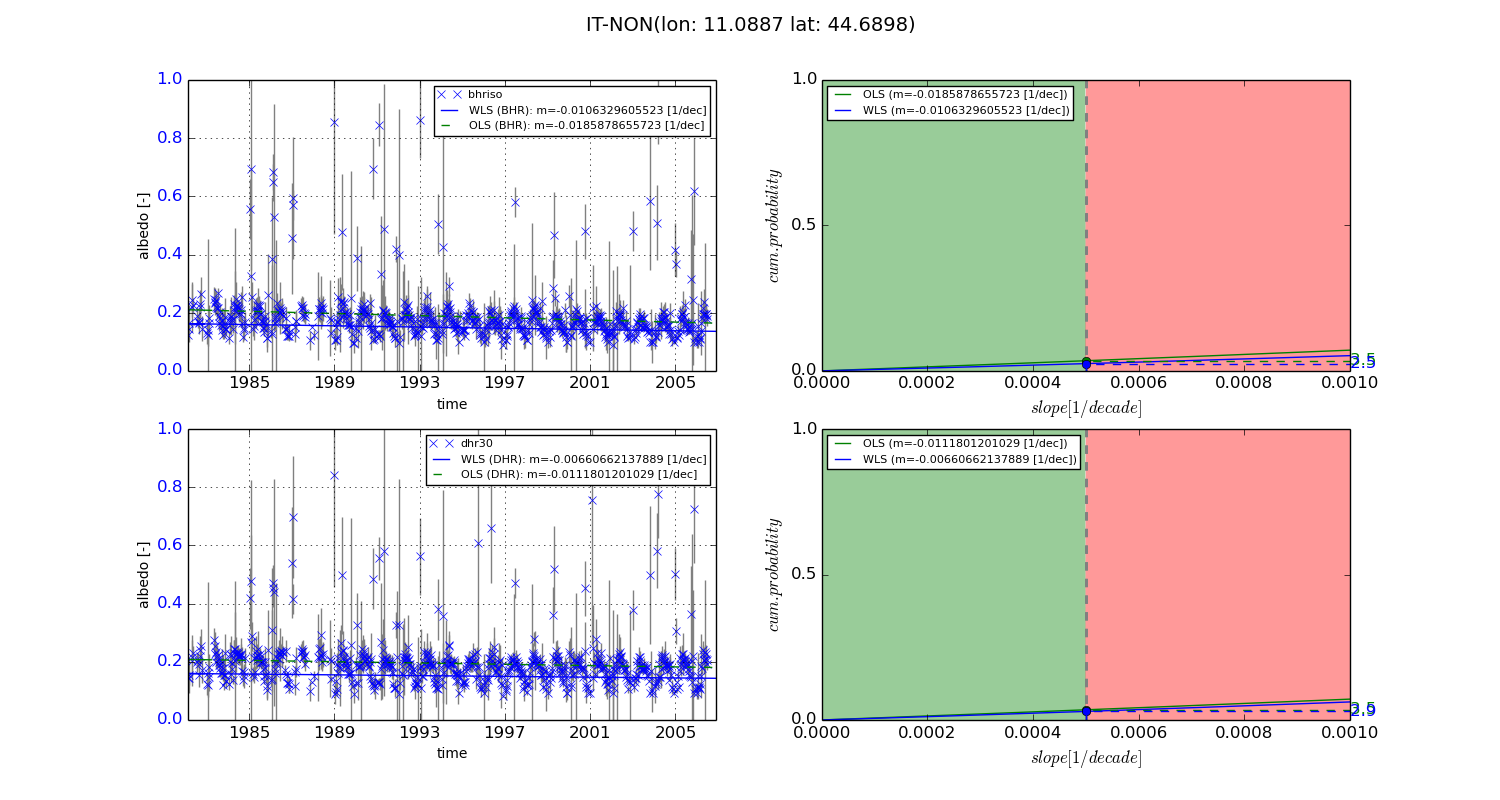
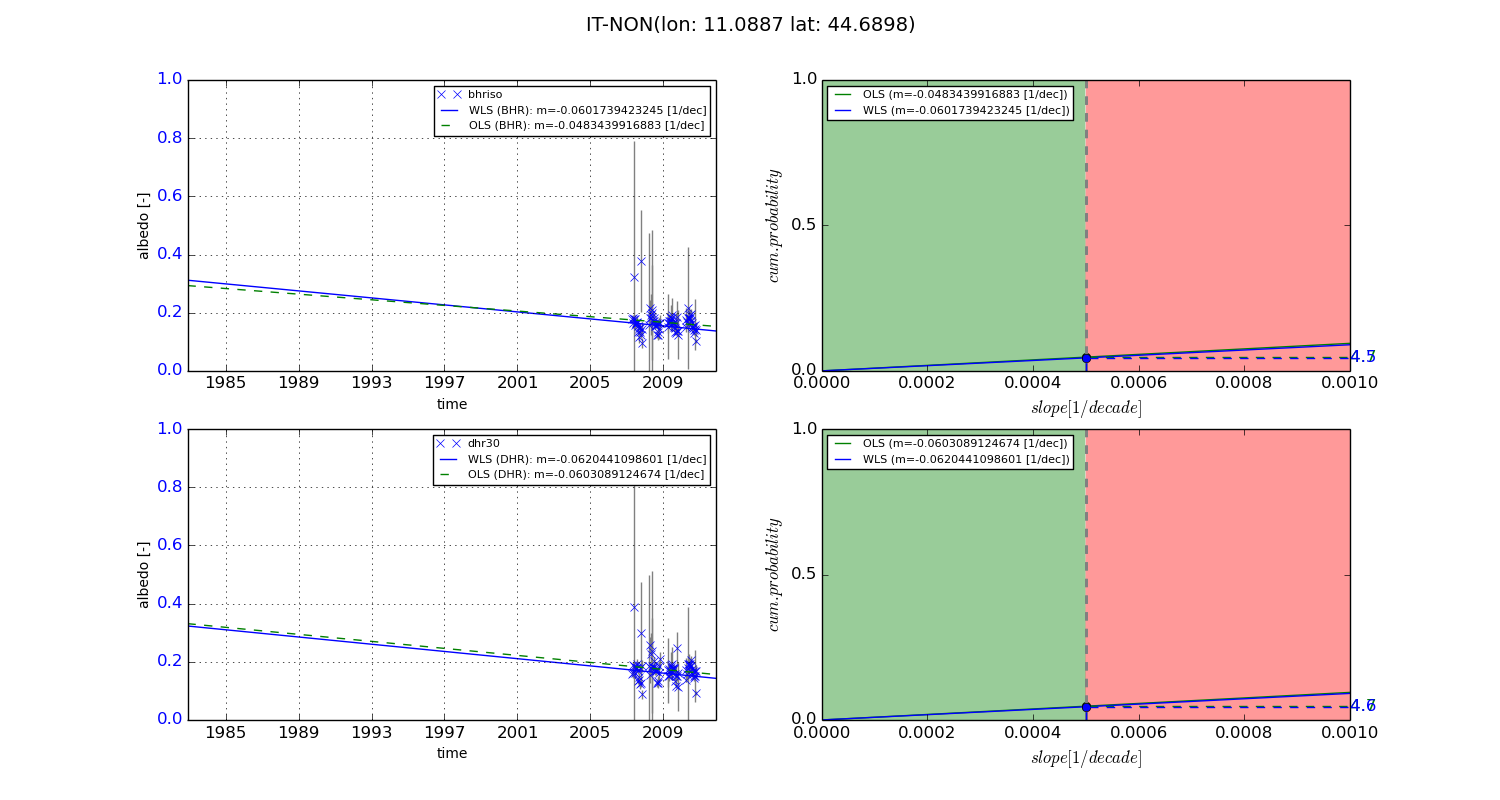
Temporal stability analysis

+000 deg (BHR)


BHR statistics

Temporal stability [1/decade]:


abs

rel


Weighted least square:

-0.0106329605523


Ordinary least square:

-0.0185878655723


Probabilities that GCOS criteria is met:

Weighted least square:

2.5 %

Ordinary least square:

3.5 %


DHR statistics

Temporal stability [1/decade]:


abs

rel


Weighted least square:

-0.00660662137889


Ordinary least square:

-0.0111801201029


Probabilities that GCOS criteria is met:

Weighted least square:

2.9 %

Ordinary least square:

3.5 %


+057/+063 deg (BHR)


BHR statistics

Temporal stability [1/decade]:


abs

rel


Weighted least square:

-0.0601739423245


Ordinary least square:

-0.0483439916883


Probabilities that GCOS criteria is met:

Weighted least square:

4.5 %

Ordinary least square:

4.7 %


DHR statistics

Temporal stability [1/decade]:


abs

rel


Weighted least square:

-0.0620441098601


Ordinary least square:

-0.0603089124674


Probabilities that GCOS criteria is met:

Weighted least square:

4.6 %

Ordinary least square:

4.7 %


Temporal anomaly analyis

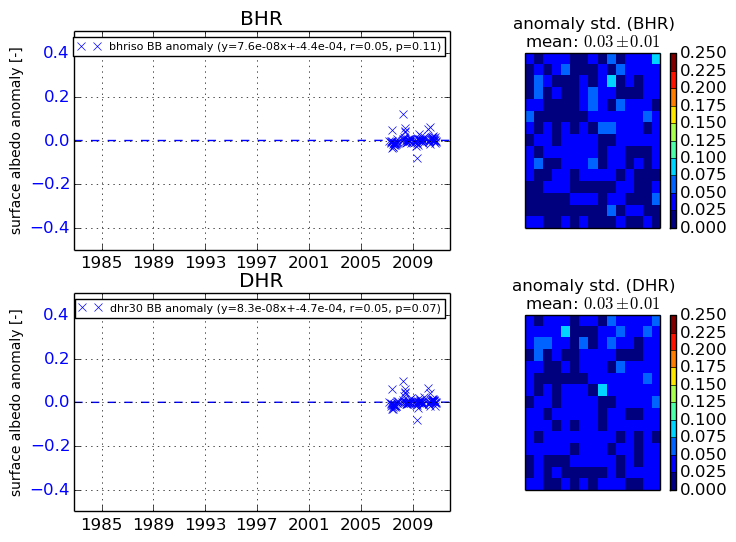
The variance of the temporal anomalies provides an additional measure about the stability of the signal AFTER removal of the mean seasonal cylce.
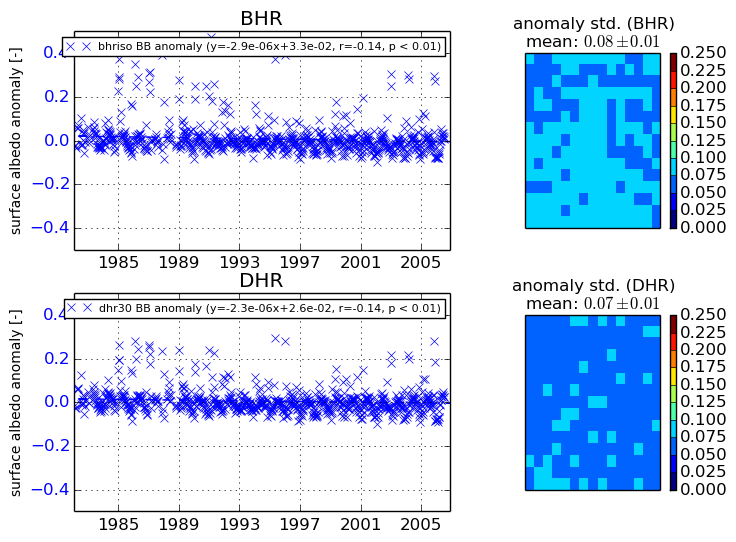
+000 deg


+057/+063 deg