IT-VIG


Location

lon / lat [deg]: 8.85 / 45.3167

Source network: FLUXNET


Geostationary surface albedo (GSA) data


“+000”


“+057/+063”


Landcover information (based on ESA CCI landcover data)


Landcover fractions @ 2km distance


Landcover fractions @ 20 km distance


Legend


Distance to open water bodies [km]:

2.99

Distance to urban areas [km]:

0.19


Radius: 1 km

Number of landcover classes:

2

Dominant landcover type:

190: urban areas

Fraction of dominant landcover type [%]:

98.0


Radius: 2 km

Number of landcover classes:

2

Dominant landcover type:

190: urban areas

Fraction of dominant landcover type [%]:

89.0


Radius: 5 km

Number of landcover classes:

5

Dominant landcover type:

190: urban areas

Fraction of dominant landcover type [%]:

32.0


Radius: 10 km

Number of landcover classes:

5

Dominant landcover type:

10: cropland, rainfed

Fraction of dominant landcover type [%]:

39.0


Radius: 20 km

Number of landcover classes:

4

Dominant landcover type:

20: cropland, irrigated or post-flooded

Fraction of dominant landcover type [%]:

45.0


Disturbances


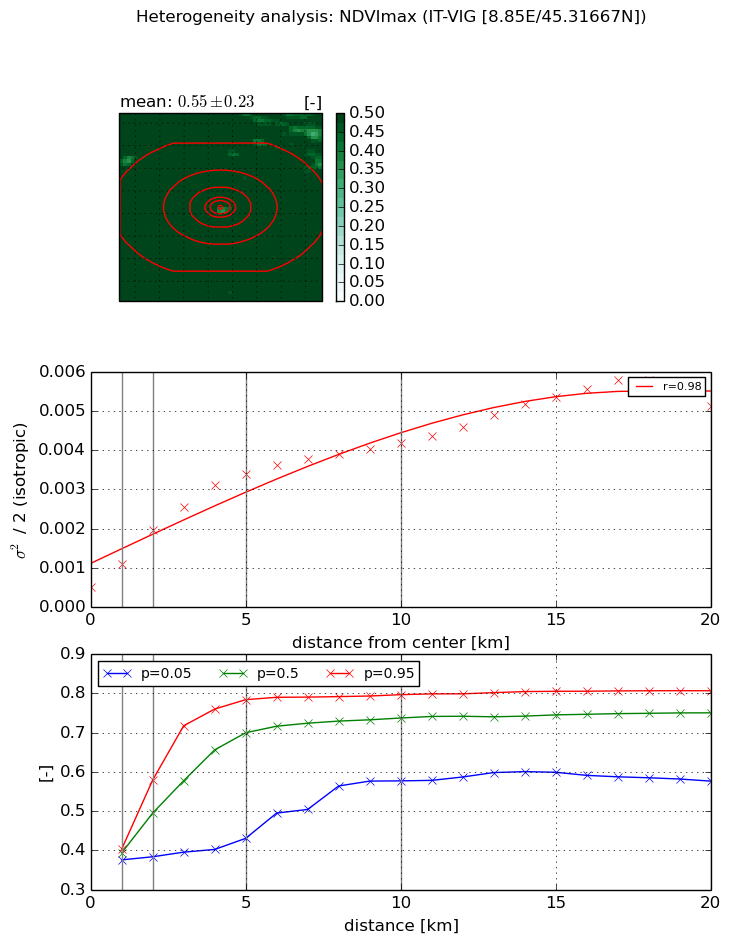
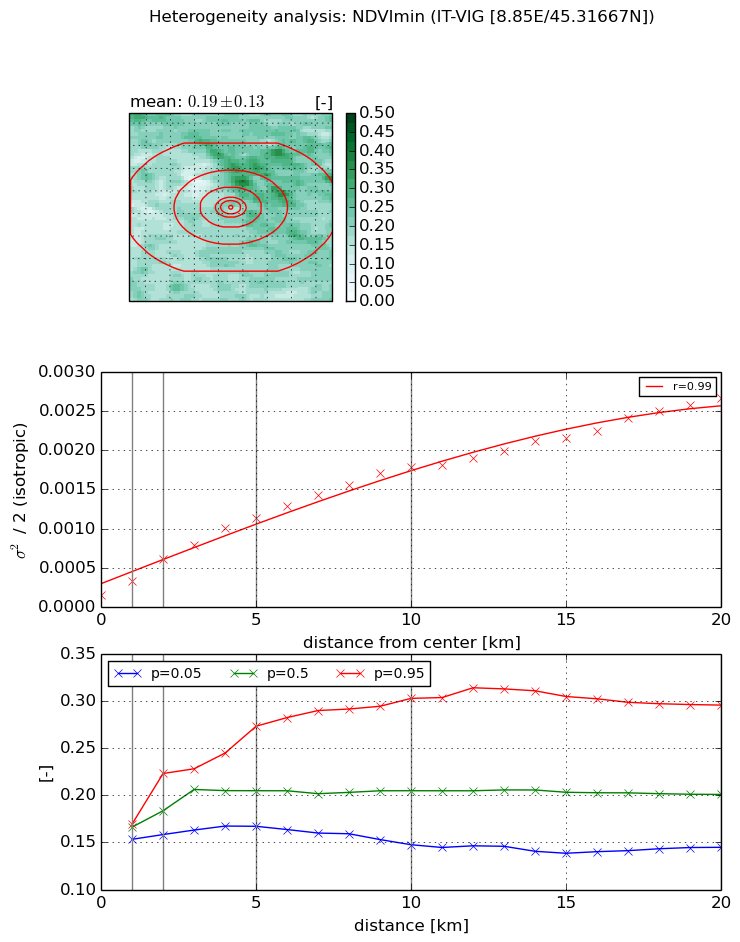
Heterogeneity analysis

The heterogeneity analysis provides information about the spatial and temporal heterogeneity of the site.

Topography


Roman et al. (2009) index


St

3.30932057632e-05

Rcv

0.972283646192

Rse

0.0

Rst

0.00698579269038

Rsv

90652.0696211


Height range @ 1km [m]

10

Height range @ 2km [m]

12

Height range @ 5km [m]

29

Height range @ 10km [m]

-999

Height range @ 20km [m]

-999


Variance slope @ 1 km

15

Variance slope @ 2 km

16

Variance slope @ 5 km

19

Variance slope @ 10 km

-999

Variance slope @ 20 km

-999


NDVI (max. NDVI composite)


Roman et al. (2009) index


St

8.43912458149

Rcv

-0.15803660543

Rse

0.0

Rst

-0.00774203783586

Rsv

0.189708465738


NDVI range @ 1km [-]

0.03

NDVI range @ 2km [-]

0.2

NDVI range @ 5km [-]

0.35

NDVI range @ 10km [-]

0.22

NDVI range @ 20km [-]

0.23


Variance slope @ 1 km

0.000582371659676

Variance slope @ 2 km

0.000722040287204

Variance slope @ 5 km

0.000600943472541

Variance slope @ 10 km

0.000353790443901

Variance slope @ 20 km

0.000228517982388


NDVI (min. NDVI composite)I


Roman et al. (2009) index


St

1.71082222471

Rcv

0.370526469088

Rse

0.0

Rst

-0.383016562157

Rsv

-0.999999772129


NDVI range @ 1km [-]

0.02

NDVI range @ 2km [-]

0.06

NDVI range @ 5km [-]

0.11

NDVI range @ 10km [-]

0.16

NDVI range @ 20km [-]

0.15


NDVI slope @ 1 km

0.000177127448367

NDVI slope @ 2 km

0.00022566758431

NDVI slope @ 5 km

0.000204222011841

NDVI slope @ 10 km

0.000163967145194

NDVI slope @ 20 km

0.000116898077854


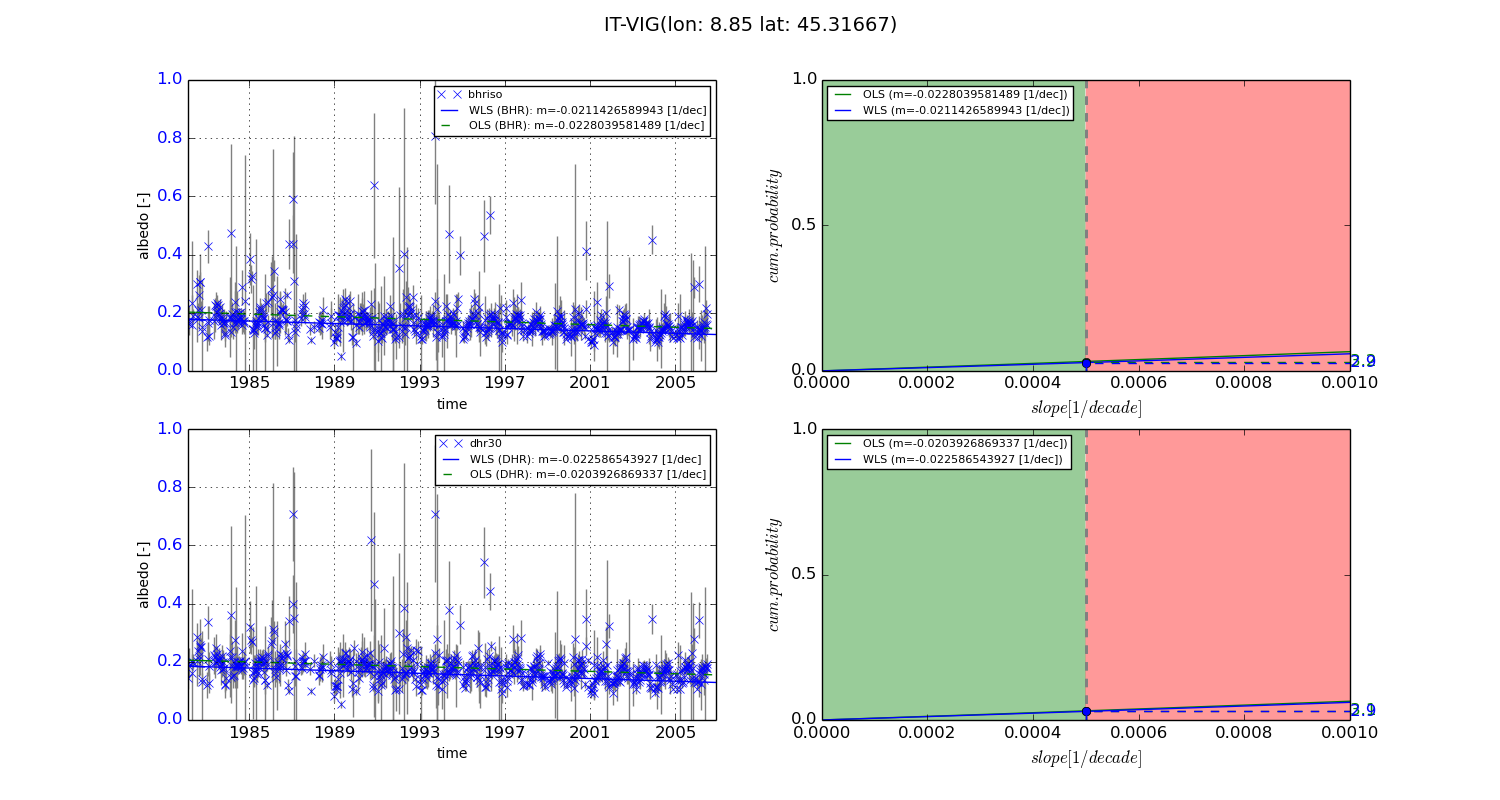
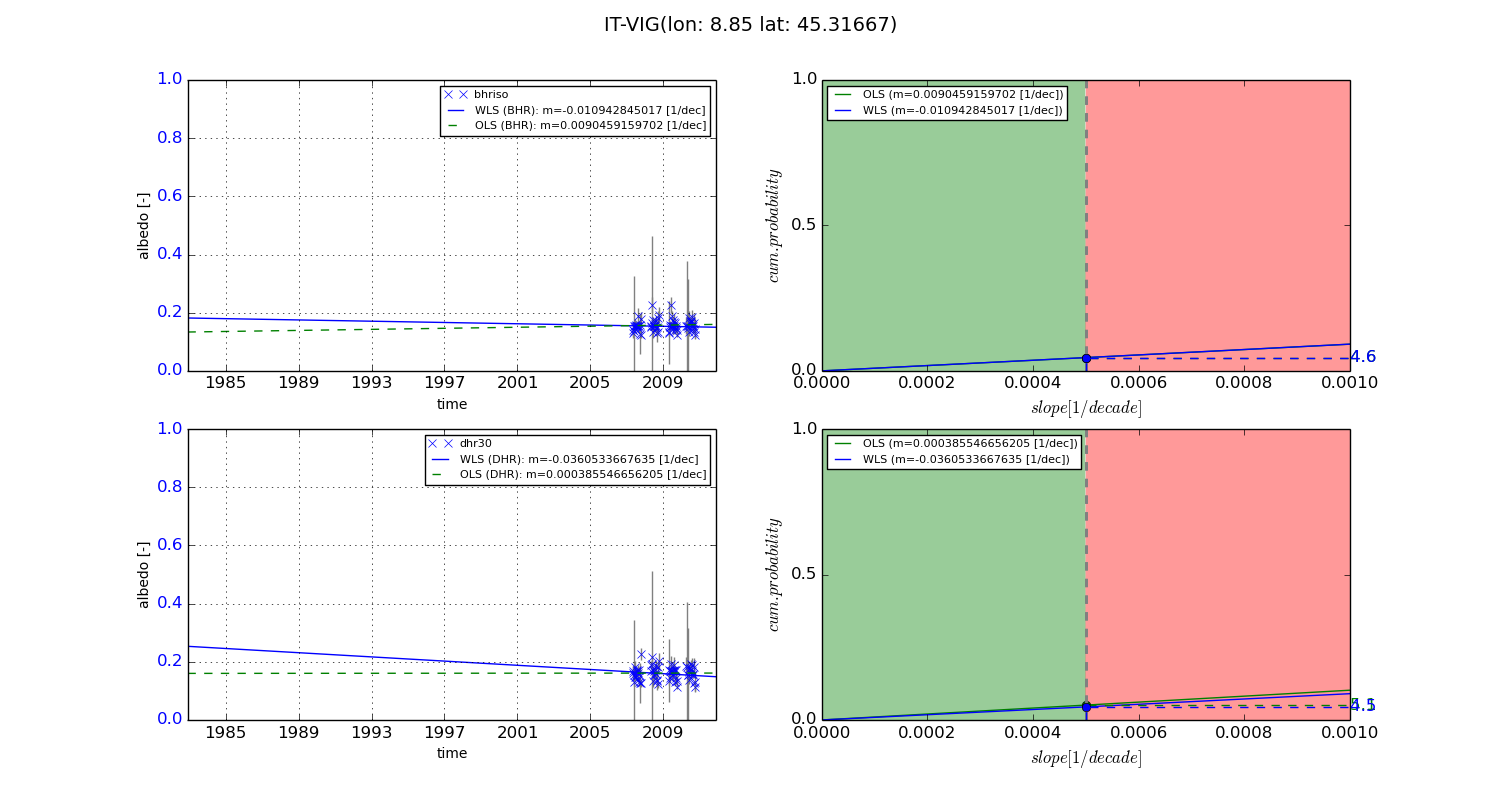
Temporal stability analysis

+000 deg (BHR)


BHR statistics

Temporal stability [1/decade]:


abs

rel


Weighted least square:

-0.0211426589943


Ordinary least square:

-0.0228039581489


Probabilities that GCOS criteria is met:

Weighted least square:

2.9 %

Ordinary least square:

3.2 %


DHR statistics

Temporal stability [1/decade]:


abs

rel


Weighted least square:

-0.022586543927


Ordinary least square:

-0.0203926869337


Probabilities that GCOS criteria is met:

Weighted least square:

2.9 %

Ordinary least square:

3.1 %


+057/+063 deg (BHR)


BHR statistics

Temporal stability [1/decade]:


abs

rel


Weighted least square:

-0.010942845017


Ordinary least square:

0.0090459159702


Probabilities that GCOS criteria is met:

Weighted least square:

4.6 %

Ordinary least square:

4.6 %


DHR statistics

Temporal stability [1/decade]:


abs

rel


Weighted least square:

-0.0360533667635


Ordinary least square:

0.000385546656205


Probabilities that GCOS criteria is met:

Weighted least square:

4.5 %

Ordinary least square:

5.1 %


Temporal anomaly analyis

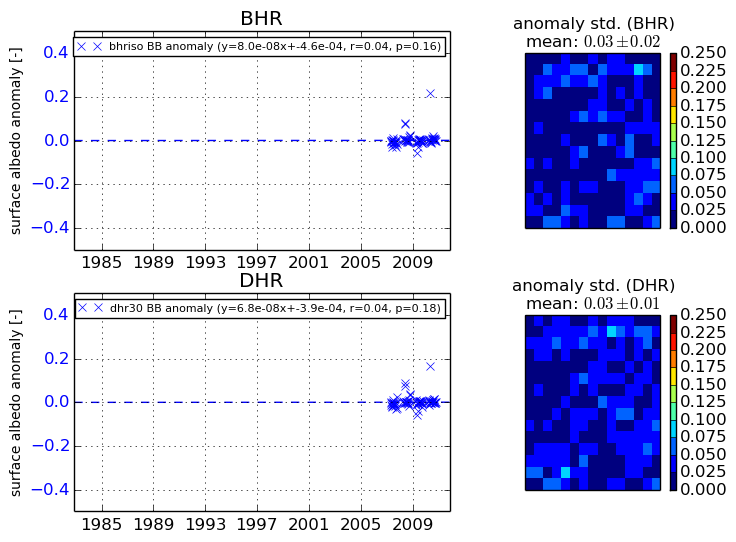
The variance of the temporal anomalies provides an additional measure about the stability of the signal AFTER removal of the mean seasonal cylce.
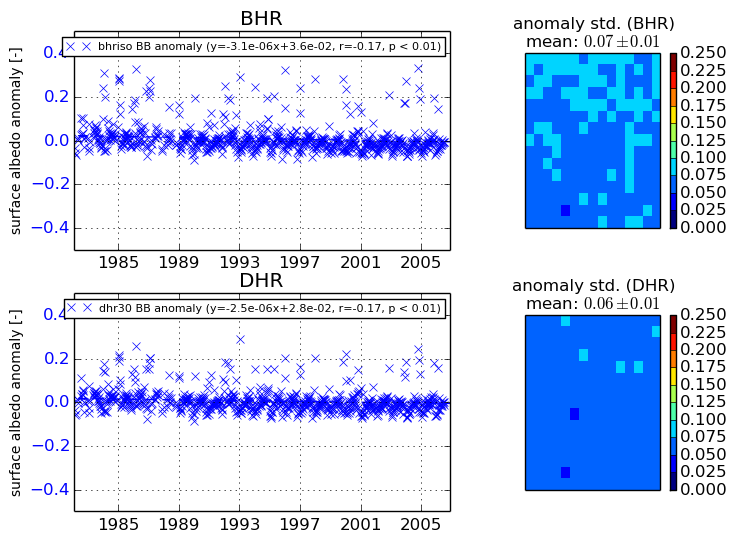
+000 deg


+057/+063 deg