ITAJUBA


Location

lon / lat [deg]: -45.4524 / -22.4132

Source network: AERONET


Geostationary surface albedo (GSA) data


“+000”


“+057/+063”


Landcover information (based on ESA CCI landcover data)


Landcover fractions @ 2km distance


Landcover fractions @ 20 km distance


Legend


Distance to open water bodies [km]:

9.69

Distance to urban areas [km]:

0.13


Radius: 1 km

Number of landcover classes:

2

Dominant landcover type:

190: urban areas

Fraction of dominant landcover type [%]:

60.0


Radius: 2 km

Number of landcover classes:

2

Dominant landcover type:

10: cropland, rainfed

Fraction of dominant landcover type [%]:

52.0


Radius: 5 km

Number of landcover classes:

4

Dominant landcover type:

10: cropland, rainfed

Fraction of dominant landcover type [%]:

62.0


Radius: 10 km

Number of landcover classes:

4

Dominant landcover type:

10: cropland, rainfed

Fraction of dominant landcover type [%]:

75.0


Radius: 20 km

Number of landcover classes:

4

Dominant landcover type:

10: cropland, rainfed

Fraction of dominant landcover type [%]:

76.0


Disturbances


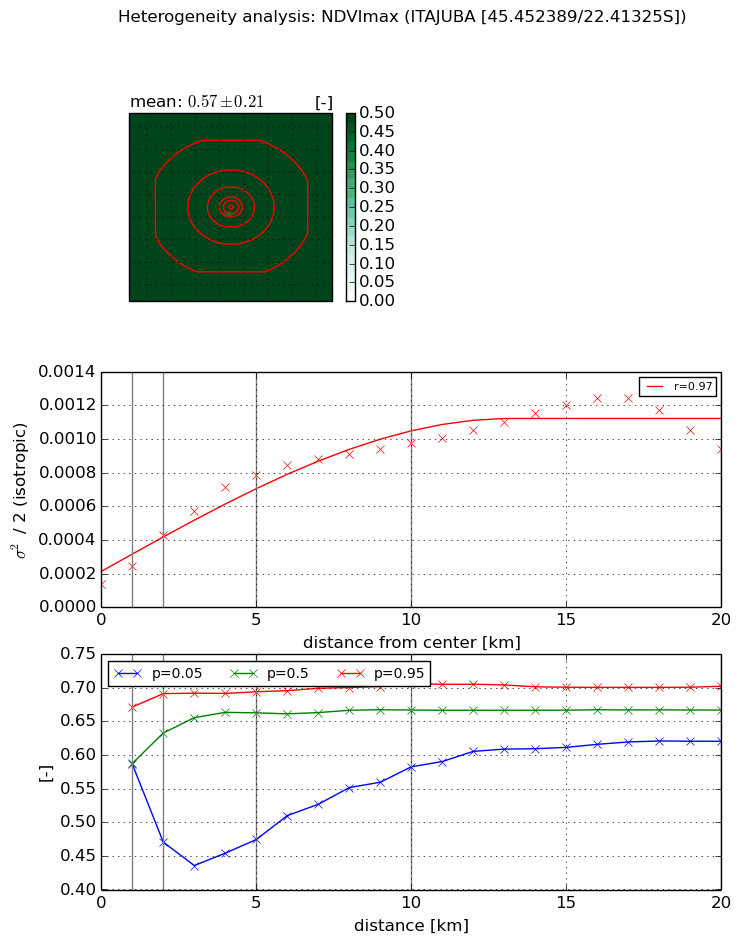
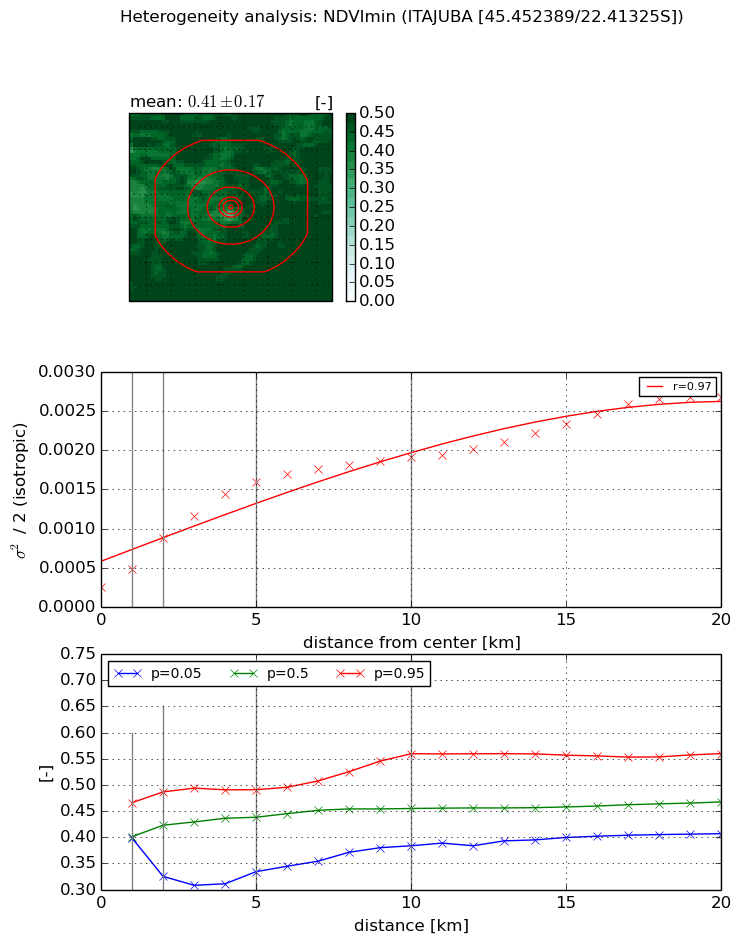
Heterogeneity analysis

The heterogeneity analysis provides information about the spatial and temporal heterogeneity of the site.

Topography


Roman et al. (2009) index


St

0.000315979527876

Rcv

0.256531986972

Rse

0.0

Rst

-0.0167210317717

Rsv

9494.01272231


Height range @ 1km [m]

121

Height range @ 2km [m]

126

Height range @ 5km [m]

217

Height range @ 10km [m]

-999

Height range @ 20km [m]

-999


Variance slope @ 1 km

3695

Variance slope @ 2 km

2769

Variance slope @ 5 km

1196

Variance slope @ 10 km

-999

Variance slope @ 20 km

-999


NDVI (max. NDVI composite)


Roman et al. (2009) index


St

4.85552978055

Rcv

-0.246774313397

Rse

0.0

Rst

0.0452214717245

Rsv

-0.325856464908


NDVI range @ 1km [-]

0.08

NDVI range @ 2km [-]

0.22

NDVI range @ 5km [-]

0.22

NDVI range @ 10km [-]

0.12

NDVI range @ 20km [-]

0.08


Variance slope @ 1 km

0.000109595963037

Variance slope @ 2 km

0.00014769802346

Variance slope @ 5 km

0.000137684799206

Variance slope @ 10 km

8.32750244704e-05

Variance slope @ 20 km

4.34639394982e-05


NDVI (min. NDVI composite)I


Roman et al. (2009) index


St

9.42126153981

Rcv

-0.202164241786

Rse

0.0

Rst

-0.0902537324942

Rsv

0.0260107188757


NDVI range @ 1km [-]

0.07

NDVI range @ 2km [-]

0.16

NDVI range @ 5km [-]

0.16

NDVI range @ 10km [-]

0.18

NDVI range @ 20km [-]

0.15


NDVI slope @ 1 km

0.000223880383365

NDVI slope @ 2 km

0.000309077943542

NDVI slope @ 5 km

0.000280245961154

NDVI slope @ 10 km

0.000164229771583

NDVI slope @ 20 km

0.000106047352209


Temporal stability analysis

+000 deg (BHR)


BHR statistics

Temporal stability [1/decade]:


abs

rel


Weighted least square:

-99999.0


Ordinary least square:

-99999.0


Probabilities that GCOS criteria is met:

Weighted least square:

-99999.0 %

Ordinary least square:

-99999.0 %


DHR statistics

Temporal stability [1/decade]:


abs

rel


Weighted least square:

-99999.0


Ordinary least square:

-99999.0


Probabilities that GCOS criteria is met:

Weighted least square:

-99999.0 %

Ordinary least square:

-99999.0 %


+057/+063 deg (BHR)


BHR statistics

Temporal stability [1/decade]:


abs

rel


Weighted least square:

None


Ordinary least square:

None


Probabilities that GCOS criteria is met:

Weighted least square:

None %

Ordinary least square:

None %


DHR statistics

Temporal stability [1/decade]:


abs

rel


Weighted least square:

None


Ordinary least square:

None


Probabilities that GCOS criteria is met:

Weighted least square:

None %

Ordinary least square:

None %


Temporal anomaly analyis

The variance of the temporal anomalies provides an additional measure about the stability of the signal AFTER removal of the mean seasonal cylce.

+000 deg


+057/+063 deg