JABIRU


Location

lon / lat [deg]: 132.8931 / -12.6607

Source network: AERONET


Geostationary surface albedo (GSA) data


“+000”


“+057/+063”


Landcover information (based on ESA CCI landcover data)


Landcover fractions @ 2km distance


Landcover fractions @ 20 km distance


Legend


Distance to open water bodies [km]:

2.08

Distance to urban areas [km]:

none in region


Radius: 1 km

Number of landcover classes:

1

Dominant landcover type:

120: Shrubland

Fraction of dominant landcover type [%]:

100.0


Radius: 2 km

Number of landcover classes:

2

Dominant landcover type:

120: Shrubland

Fraction of dominant landcover type [%]:

99.0


Radius: 5 km

Number of landcover classes:

3

Dominant landcover type:

120: Shrubland

Fraction of dominant landcover type [%]:

91.0


Radius: 10 km

Number of landcover classes:

2

Dominant landcover type:

120: Shrubland

Fraction of dominant landcover type [%]:

97.0


Radius: 20 km

Number of landcover classes:

3

Dominant landcover type:

120: Shrubland

Fraction of dominant landcover type [%]:

95.0


Disturbances


Heterogeneity analysis

The heterogeneity analysis provides information about the spatial and temporal heterogeneity of the site.

Topography


Roman et al. (2009) index


St

3.67424975324e-07

Rcv

0.189937320478

Rse

0.0

Rst

0.0655182764639

Rsv

8164931.9116


Height range @ 1km [m]

12

Height range @ 2km [m]

14

Height range @ 5km [m]

28

Height range @ 10km [m]

-999

Height range @ 20km [m]

-999


Variance slope @ 1 km

39

Variance slope @ 2 km

32

Variance slope @ 5 km

10

Variance slope @ 10 km

-999

Variance slope @ 20 km

-999


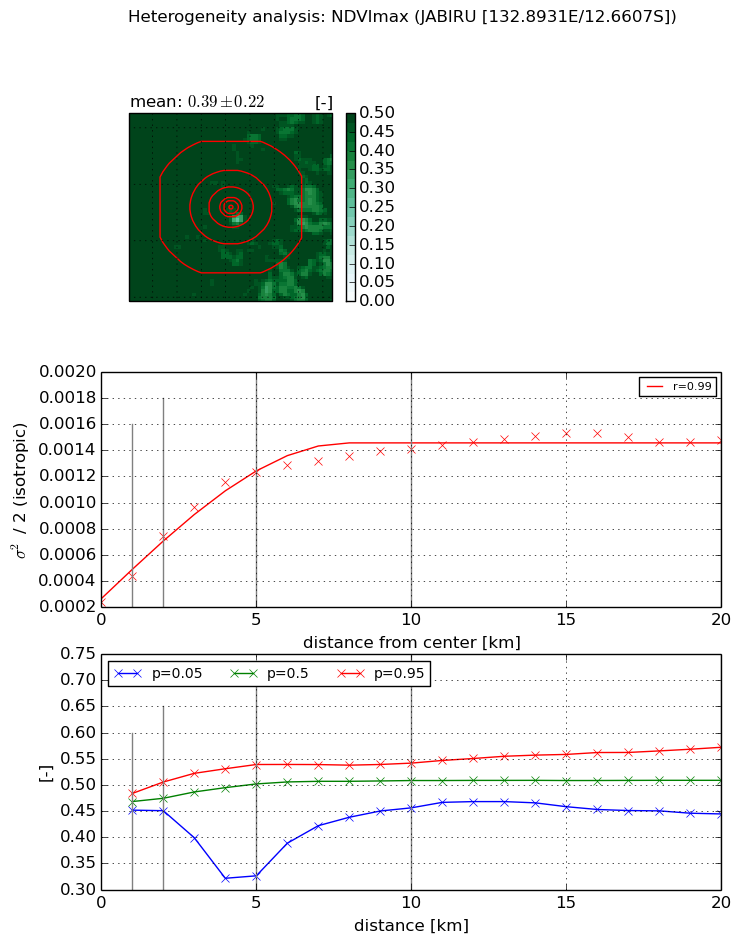
NDVI (max. NDVI composite)


Roman et al. (2009) index


St

4.50446344983e-07

Rcv

0.284729676456

Rse

0.0

Rst

0.39414301569

Rsv

6660060.02183


NDVI range @ 1km [-]

0.03

NDVI range @ 2km [-]

0.05

NDVI range @ 5km [-]

0.21

NDVI range @ 10km [-]

0.09

NDVI range @ 20km [-]

0.13


Variance slope @ 1 km

0.000200450974201

Variance slope @ 2 km

0.000251827276618

Variance slope @ 5 km

0.000209835886275

Variance slope @ 10 km

0.000112117030994

Variance slope @ 20 km

4.73314939308e-05


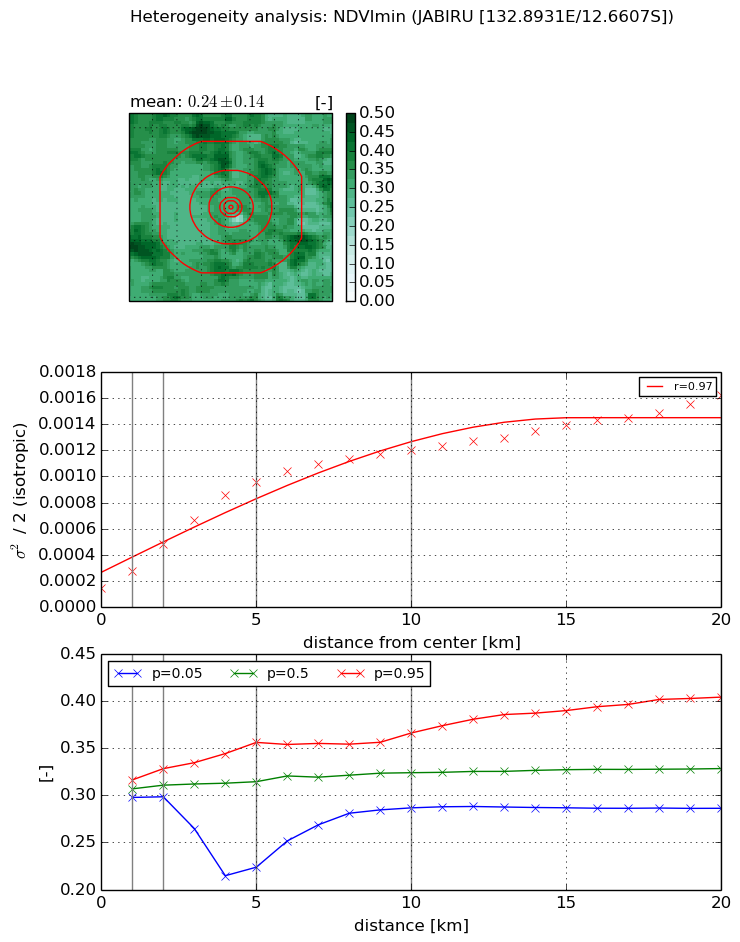
NDVI (min. NDVI composite)I


Roman et al. (2009) index


St

7.87885105235e-07

Rcv

0.349691988621

Rse

0.0

Rst

0.486357066292

Rsv

3807660.94112


NDVI range @ 1km [-]

0.02

NDVI range @ 2km [-]

0.03

NDVI range @ 5km [-]

0.13

NDVI range @ 10km [-]

0.08

NDVI range @ 20km [-]

0.12


NDVI slope @ 1 km

0.000127555917583

NDVI slope @ 2 km

0.00016879007723

NDVI slope @ 5 km

0.000171150161215

NDVI slope @ 10 km

0.000107493955093

NDVI slope @ 20 km

6.169012963e-05


Temporal stability analysis

+000 deg (BHR)


BHR statistics

Temporal stability [1/decade]:


abs

rel


Weighted least square:

None


Ordinary least square:

None


Probabilities that GCOS criteria is met:

Weighted least square:

None %

Ordinary least square:

None %


DHR statistics

Temporal stability [1/decade]:


abs

rel


Weighted least square:

None


Ordinary least square:

None


Probabilities that GCOS criteria is met:

Weighted least square:

None %

Ordinary least square:

None %


+057/+063 deg (BHR)


BHR statistics

Temporal stability [1/decade]:


abs

rel


Weighted least square:

-99999.0


Ordinary least square:

-99999.0


Probabilities that GCOS criteria is met:

Weighted least square:

-99999.0 %

Ordinary least square:

-99999.0 %


DHR statistics

Temporal stability [1/decade]:


abs

rel


Weighted least square:

-99999.0


Ordinary least square:

-99999.0


Probabilities that GCOS criteria is met:

Weighted least square:

-99999.0 %

Ordinary least square:

-99999.0 %


Temporal anomaly analyis

The variance of the temporal anomalies provides an additional measure about the stability of the signal AFTER removal of the mean seasonal cylce.

+000 deg


+057/+063 deg