JAIPUR


Location

lon / lat [deg]: 75.8062 / 26.9058

Source network: AERONET


Geostationary surface albedo (GSA) data


“+000”


“+057/+063”


Landcover information (based on ESA CCI landcover data)


Landcover fractions @ 2km distance


Landcover fractions @ 20 km distance


Legend


Distance to open water bodies [km]:

6.68

Distance to urban areas [km]:

0.14


Radius: 1 km

Number of landcover classes:

1

Dominant landcover type:

190: urban areas

Fraction of dominant landcover type [%]:

100.0


Radius: 2 km

Number of landcover classes:

1

Dominant landcover type:

190: urban areas

Fraction of dominant landcover type [%]:

100.0


Radius: 5 km

Number of landcover classes:

1

Dominant landcover type:

190: urban areas

Fraction of dominant landcover type [%]:

100.0


Radius: 10 km

Number of landcover classes:

4

Dominant landcover type:

190: urban areas

Fraction of dominant landcover type [%]:

87.0


Radius: 20 km

Number of landcover classes:

5

Dominant landcover type:

20: cropland, irrigated or post-flooded

Fraction of dominant landcover type [%]:

36.0


Disturbances


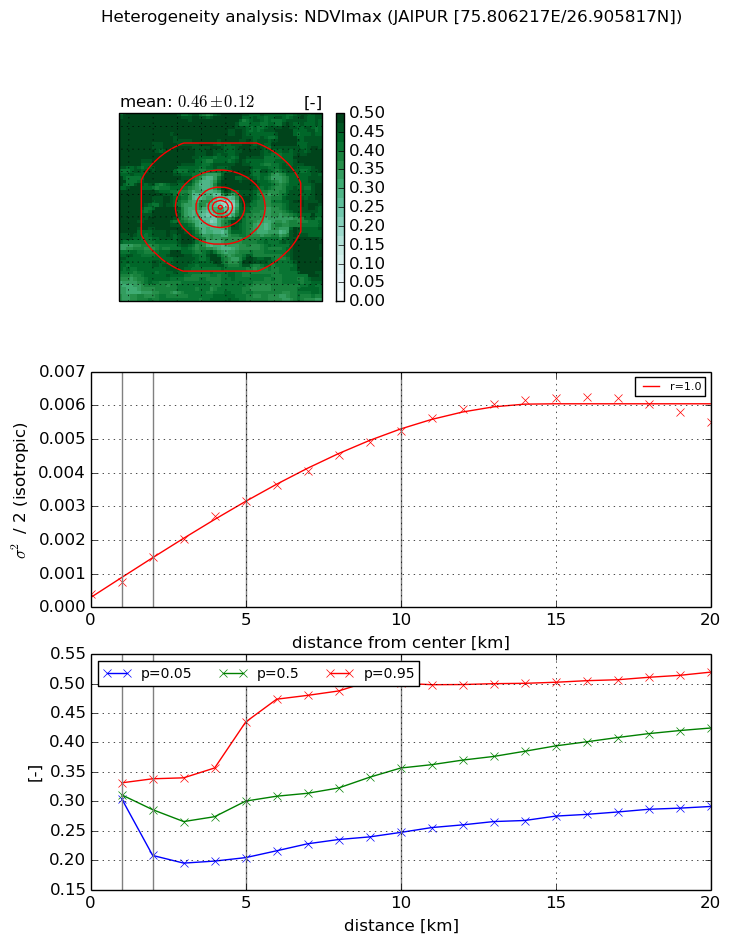
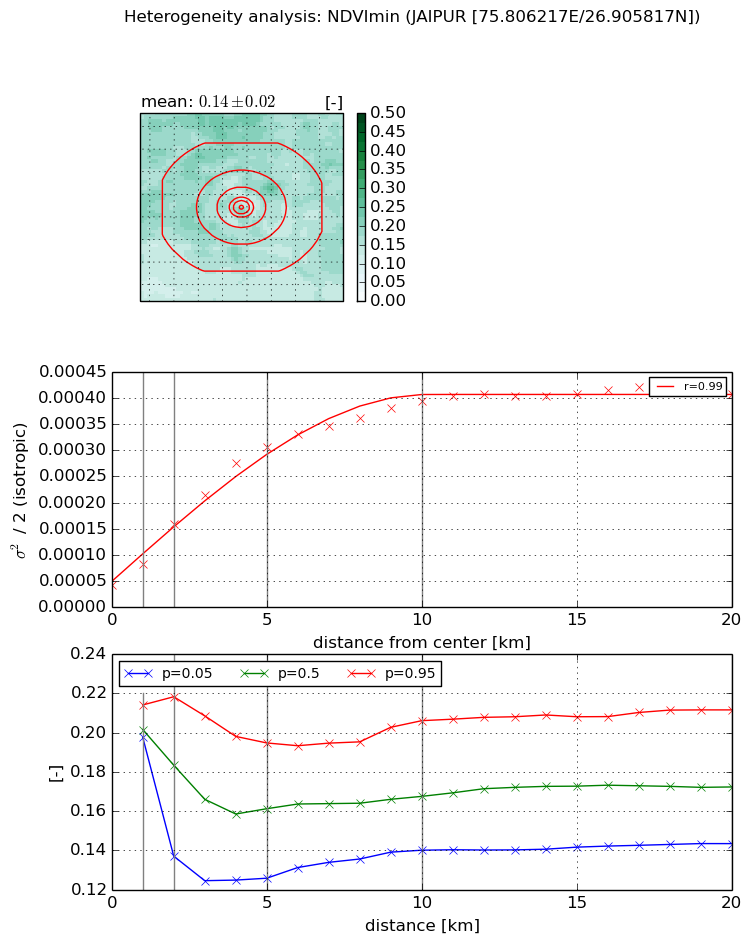
Heterogeneity analysis

The heterogeneity analysis provides information about the spatial and temporal heterogeneity of the site.

Topography


Roman et al. (2009) index


St

0.958477263449

Rcv

2.20497256767

Rse

0.0

Rst

-2.97912866001e-05

Rsv

-0.924962340679


Height range @ 1km [m]

11

Height range @ 2km [m]

21

Height range @ 5km [m]

112

Height range @ 10km [m]

-999

Height range @ 20km [m]

-999


Variance slope @ 1 km

549

Variance slope @ 2 km

357

Variance slope @ 5 km

177

Variance slope @ 10 km

-999

Variance slope @ 20 km

-999


NDVI (max. NDVI composite)


Roman et al. (2009) index


St

4.16718835601

Rcv

0.285238681477

Rse

0.0

Rst

-0.16433195185

Rsv

0.270339230039


NDVI range @ 1km [-]

0.03

NDVI range @ 2km [-]

0.13

NDVI range @ 5km [-]

0.23

NDVI range @ 10km [-]

0.25

NDVI range @ 20km [-]

0.23


Variance slope @ 1 km

0.000363394936824

Variance slope @ 2 km

0.000543979881316

Variance slope @ 5 km

0.000575325955579

Variance slope @ 10 km

0.000501115750557

Variance slope @ 20 km

0.000284219740023


NDVI (min. NDVI composite)I


Roman et al. (2009) index


St

4.45673231399

Rcv

-0.20372376914

Rse

0.0

Rst

0.231976894825

Rsv

-0.237438261293


NDVI range @ 1km [-]

0.02

NDVI range @ 2km [-]

0.08

NDVI range @ 5km [-]

0.07

NDVI range @ 10km [-]

0.07

NDVI range @ 20km [-]

0.07


NDVI slope @ 1 km

4.00122183675e-05

NDVI slope @ 2 km

5.80594978862e-05

NDVI slope @ 5 km

5.57086041716e-05

NDVI slope @ 10 km

3.51940677198e-05

NDVI slope @ 20 km

1.56995876274e-05


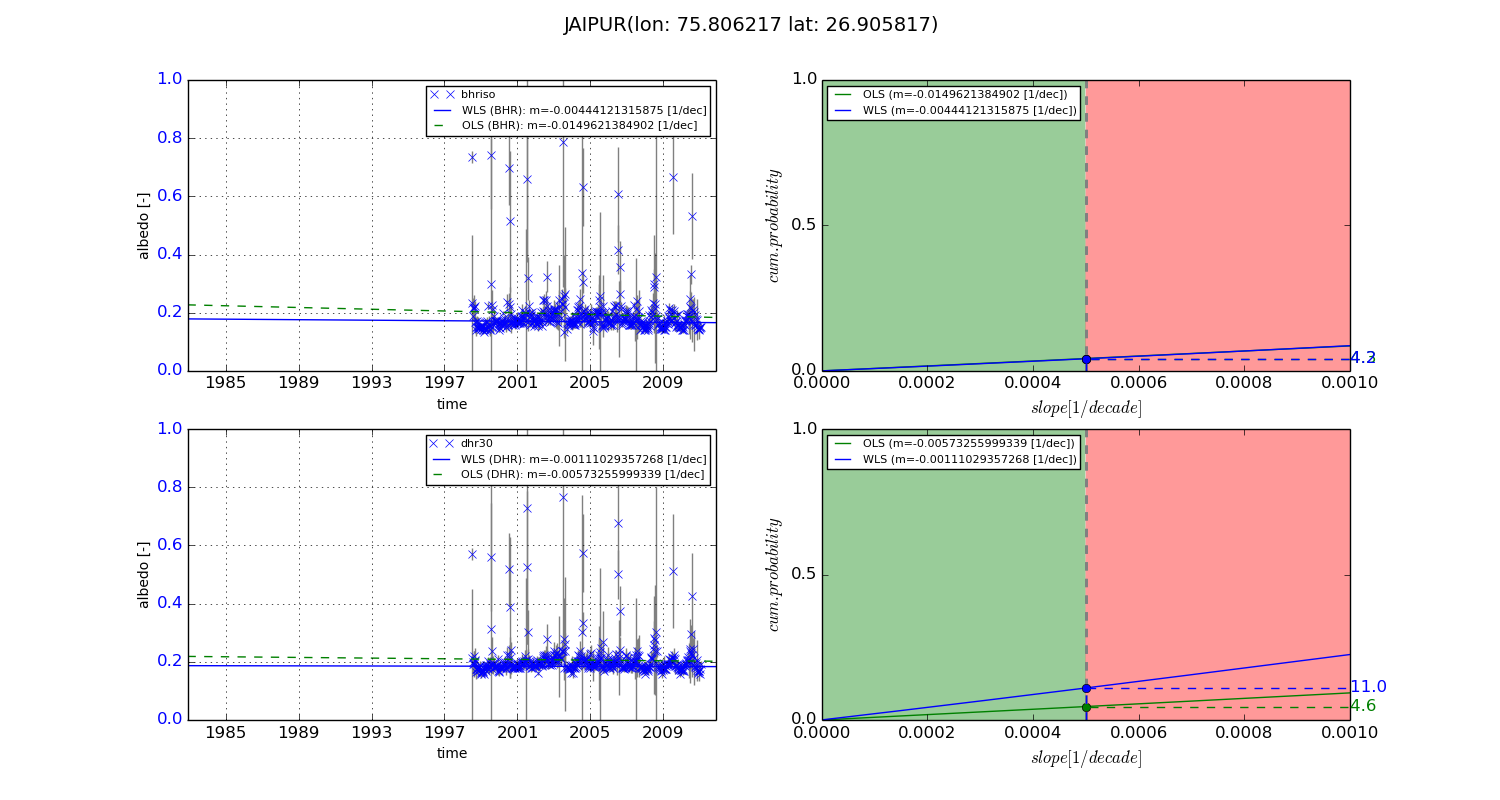
Temporal stability analysis

+000 deg (BHR)


BHR statistics

Temporal stability [1/decade]:


abs

rel


Weighted least square:

-99999.0


Ordinary least square:

-99999.0


Probabilities that GCOS criteria is met:

Weighted least square:

-99999.0 %

Ordinary least square:

-99999.0 %


DHR statistics

Temporal stability [1/decade]:


abs

rel


Weighted least square:

-99999.0


Ordinary least square:

-99999.0


Probabilities that GCOS criteria is met:

Weighted least square:

-99999.0 %

Ordinary least square:

-99999.0 %


+057/+063 deg (BHR)


BHR statistics

Temporal stability [1/decade]:


abs

rel


Weighted least square:

-0.00444121315875


Ordinary least square:

-0.0149621384902


Probabilities that GCOS criteria is met:

Weighted least square:

4.2 %

Ordinary least square:

4.3 %


DHR statistics

Temporal stability [1/decade]:


abs

rel


Weighted least square:

-0.00111029357268


Ordinary least square:

-0.00573255999339


Probabilities that GCOS criteria is met:

Weighted least square:

11.0 %

Ordinary least square:

4.6 %


Temporal anomaly analyis

The variance of the temporal anomalies provides an additional measure about the stability of the signal AFTER removal of the mean seasonal cylce.

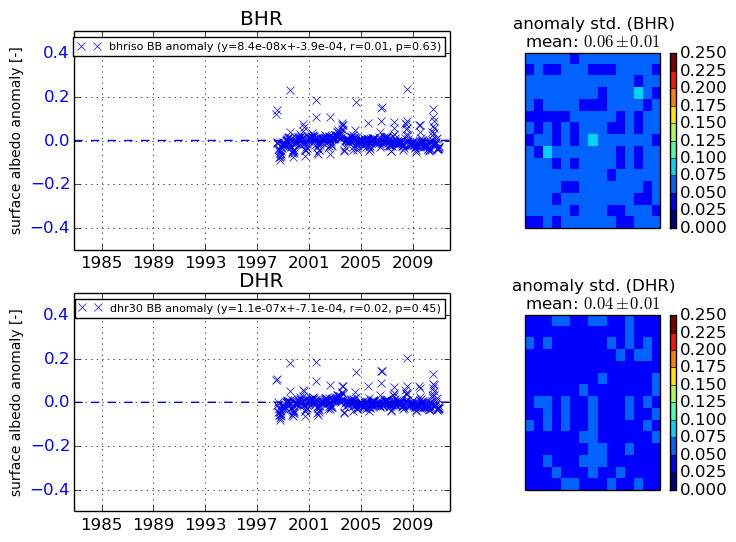
+000 deg


+057/+063 deg