JAMTOWN


Location

lon / lat [deg]: -63.1 / -9.2

Source network: AERONET


Geostationary surface albedo (GSA) data


“+000”


“+057/+063”


Landcover information (based on ESA CCI landcover data)


Landcover fractions @ 2km distance


Landcover fractions @ 20 km distance


Legend


Distance to open water bodies [km]:

7.26

Distance to urban areas [km]:

8.14


Radius: 1 km

Number of landcover classes:

2

Dominant landcover type:

50: Tree cover, broadleaved, evergreen, closed to open (>15%)

Fraction of dominant landcover type [%]:

97.0


Radius: 2 km

Number of landcover classes:

3

Dominant landcover type:

50: Tree cover, broadleaved, evergreen, closed to open (>15%)

Fraction of dominant landcover type [%]:

91.0


Radius: 5 km

Number of landcover classes:

3

Dominant landcover type:

50: Tree cover, broadleaved, evergreen, closed to open (>15%)

Fraction of dominant landcover type [%]:

95.0


Radius: 10 km

Number of landcover classes:

5

Dominant landcover type:

50: Tree cover, broadleaved, evergreen, closed to open (>15%)

Fraction of dominant landcover type [%]:

90.0


Radius: 20 km

Number of landcover classes:

4

Dominant landcover type:

50: Tree cover, broadleaved, evergreen, closed to open (>15%)

Fraction of dominant landcover type [%]:

89.0


Disturbances


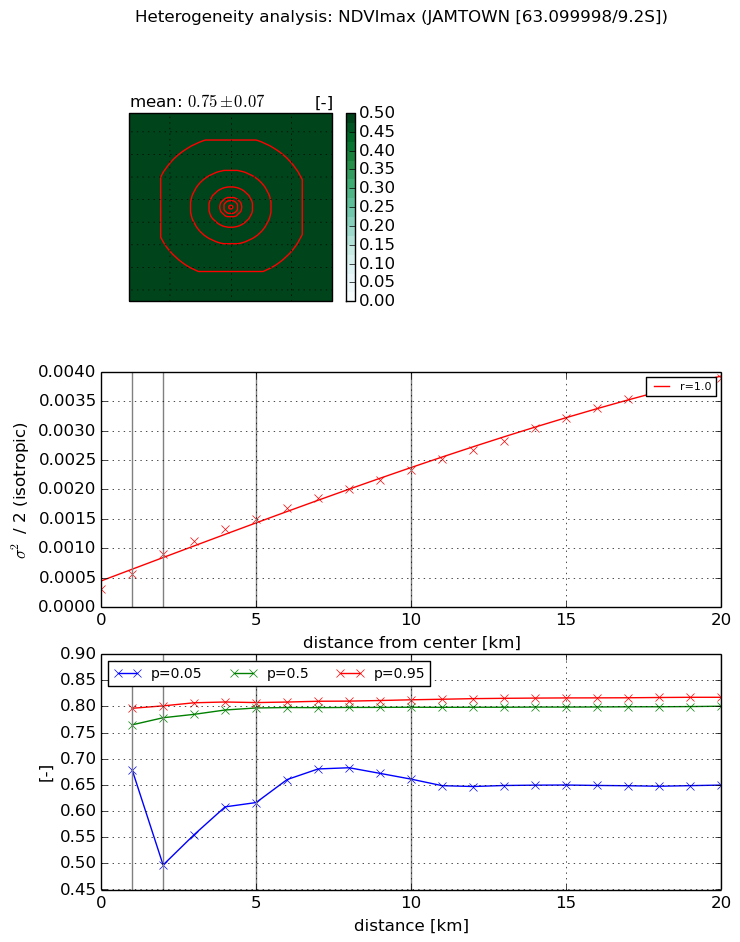
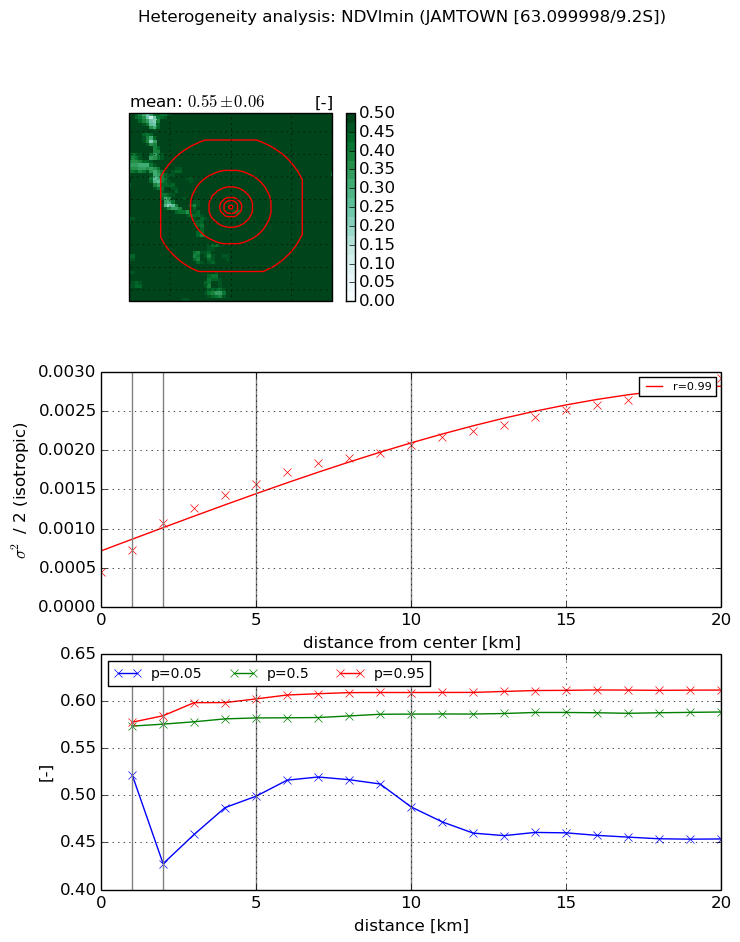
Heterogeneity analysis

The heterogeneity analysis provides information about the spatial and temporal heterogeneity of the site.

Topography


Roman et al. (2009) index


St

2.53321388025

Rcv

0.792141741437

Rse

0.0

Rst

-8.55826649922e-09

Rsv

-0.392124617481


Height range @ 1km [m]

1

Height range @ 2km [m]

3

Height range @ 5km [m]

10

Height range @ 10km [m]

-999

Height range @ 20km [m]

-999


Variance slope @ 1 km

0

Variance slope @ 2 km

1

Variance slope @ 5 km

2

Variance slope @ 10 km

-999

Variance slope @ 20 km

-999


NDVI (max. NDVI composite)


Roman et al. (2009) index


St

2.58762941592

Rcv

-0.333415024101

Rse

0.0

Rst

0.361512209931

Rsv

-0.464435069373


NDVI range @ 1km [-]

0.12

NDVI range @ 2km [-]

0.3

NDVI range @ 5km [-]

0.19

NDVI range @ 10km [-]

0.15

NDVI range @ 20km [-]

0.17


Variance slope @ 1 km

0.000244034195443

Variance slope @ 2 km

0.000294990570397

Variance slope @ 5 km

0.000240768436144

Variance slope @ 10 km

0.000196793462607

Variance slope @ 20 km

0.000176238944847


NDVI (min. NDVI composite)I


Roman et al. (2009) index


St

2.80827795022

Rcv

-0.308937070792

Rse

0.0

Rst

0.397905631562

Rsv

-0.361427623155


NDVI range @ 1km [-]

0.06

NDVI range @ 2km [-]

0.16

NDVI range @ 5km [-]

0.1

NDVI range @ 10km [-]

0.12

NDVI range @ 20km [-]

0.16


NDVI slope @ 1 km

0.000281030587217

NDVI slope @ 2 km

0.00031408735662

NDVI slope @ 5 km

0.000224245635843

NDVI slope @ 10 km

0.000153976491286

NDVI slope @ 20 km

0.000108721968025


Temporal stability analysis

+000 deg (BHR)


BHR statistics

Temporal stability [1/decade]:


abs

rel


Weighted least square:

-99999.0


Ordinary least square:

-99999.0


Probabilities that GCOS criteria is met:

Weighted least square:

-99999.0 %

Ordinary least square:

-99999.0 %


DHR statistics

Temporal stability [1/decade]:


abs

rel


Weighted least square:

-99999.0


Ordinary least square:

-99999.0


Probabilities that GCOS criteria is met:

Weighted least square:

-99999.0 %

Ordinary least square:

-99999.0 %


+057/+063 deg (BHR)


BHR statistics

Temporal stability [1/decade]:


abs

rel


Weighted least square:

None


Ordinary least square:

None


Probabilities that GCOS criteria is met:

Weighted least square:

None %

Ordinary least square:

None %


DHR statistics

Temporal stability [1/decade]:


abs

rel


Weighted least square:

None


Ordinary least square:

None


Probabilities that GCOS criteria is met:

Weighted least square:

None %

Ordinary least square:

None %


Temporal anomaly analyis

The variance of the temporal anomalies provides an additional measure about the stability of the signal AFTER removal of the mean seasonal cylce.

+000 deg


+057/+063 deg