JARU


Location

lon / lat [deg]: -62.5477 / -10.3862

Source network: AERONET


Geostationary surface albedo (GSA) data


“+000”


“+057/+063”


Landcover information (based on ESA CCI landcover data)


Landcover fractions @ 2km distance


Landcover fractions @ 20 km distance


Legend


Distance to open water bodies [km]:

36.21

Distance to urban areas [km]:

7.74


Radius: 1 km

Number of landcover classes:

4

Dominant landcover type:

11: cropland, rainfed, herbaceous cover

Fraction of dominant landcover type [%]:

62.0


Radius: 2 km

Number of landcover classes:

5

Dominant landcover type:

11: cropland, rainfed, herbaceous cover

Fraction of dominant landcover type [%]:

50.0


Radius: 5 km

Number of landcover classes:

5

Dominant landcover type:

11: cropland, rainfed, herbaceous cover

Fraction of dominant landcover type [%]:

57.0


Radius: 10 km

Number of landcover classes:

6

Dominant landcover type:

11: cropland, rainfed, herbaceous cover

Fraction of dominant landcover type [%]:

55.0


Radius: 20 km

Number of landcover classes:

5

Dominant landcover type:

11: cropland, rainfed, herbaceous cover

Fraction of dominant landcover type [%]:

51.0


Disturbances


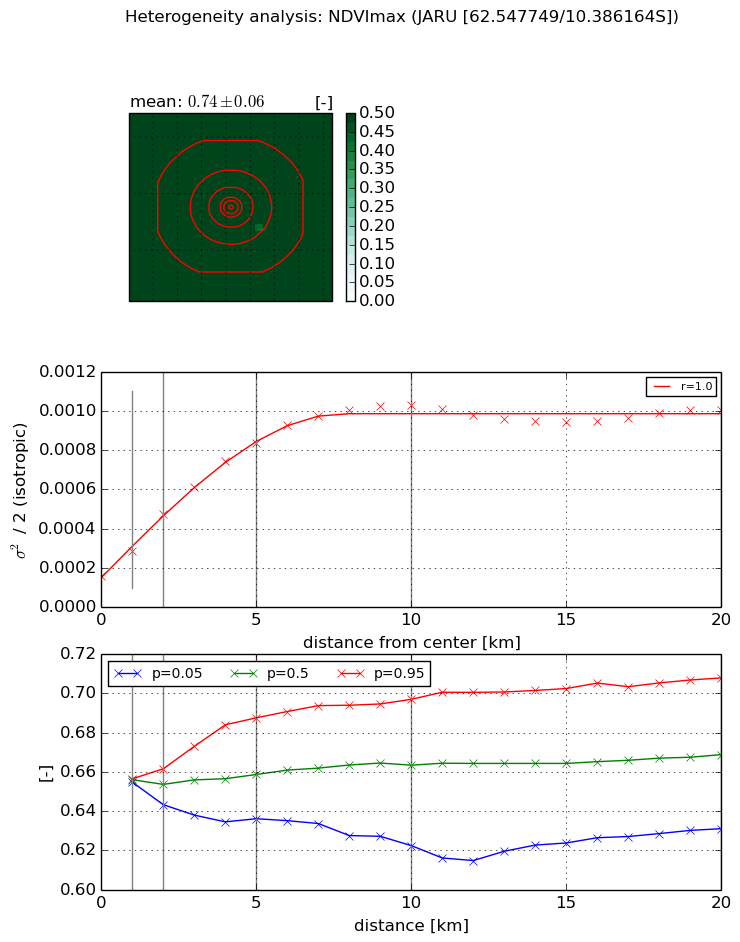
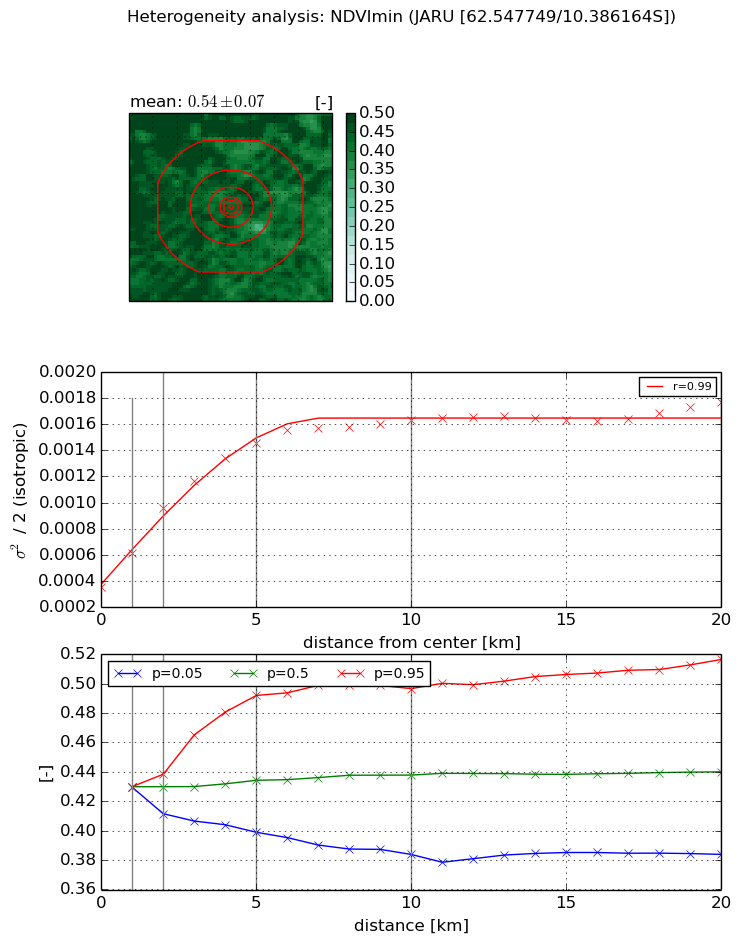
Heterogeneity analysis

The heterogeneity analysis provides information about the spatial and temporal heterogeneity of the site.

Topography


Roman et al. (2009) index


St

1.77076357642

Rcv

0.695695652735

Rse

0.0

Rst

-4.28967166295e-06

Rsv

-0.998484442202


Height range @ 1km [m]

5

Height range @ 2km [m]

11

Height range @ 5km [m]

28

Height range @ 10km [m]

-999

Height range @ 20km [m]

-999


Variance slope @ 1 km

4

Variance slope @ 2 km

8

Variance slope @ 5 km

18

Variance slope @ 10 km

-999

Variance slope @ 20 km

-999


NDVI (max. NDVI composite)


Roman et al. (2009) index


St

1.53107000795e-06

Rcv

0.491943189034

Rse

0.0

Rst

0.744800048896

Rsv

1959412.75767


NDVI range @ 1km [-]

0.0

NDVI range @ 2km [-]

0.02

NDVI range @ 5km [-]

0.05

NDVI range @ 10km [-]

0.07

NDVI range @ 20km [-]

0.08


Variance slope @ 1 km

0.000127344858534

Variance slope @ 2 km

0.000157372406001

Variance slope @ 5 km

0.000139433310322

Variance slope @ 10 km

8.90679041202e-05

Variance slope @ 20 km

3.01812396673e-05


NDVI (min. NDVI composite)I


Roman et al. (2009) index


St

3.06880576993

Rcv

0.481808083987

Rse

0.0

Rst

-0.154416572112

Rsv

-0.341354319213


NDVI range @ 1km [-]

0.0

NDVI range @ 2km [-]

0.03

NDVI range @ 5km [-]

0.09

NDVI range @ 10km [-]

0.11

NDVI range @ 20km [-]

0.13


NDVI slope @ 1 km

0.000265287947176

NDVI slope @ 2 km

0.000305523109044

NDVI slope @ 5 km

0.000226087671029

NDVI slope @ 10 km

0.000120239846789

NDVI slope @ 20 km

4.77949529769e-05


Temporal stability analysis

+000 deg (BHR)


BHR statistics

Temporal stability [1/decade]:


abs

rel


Weighted least square:

-99999.0


Ordinary least square:

-99999.0


Probabilities that GCOS criteria is met:

Weighted least square:

-99999.0 %

Ordinary least square:

-99999.0 %


DHR statistics

Temporal stability [1/decade]:


abs

rel


Weighted least square:

-99999.0


Ordinary least square:

-99999.0


Probabilities that GCOS criteria is met:

Weighted least square:

-99999.0 %

Ordinary least square:

-99999.0 %


+057/+063 deg (BHR)


BHR statistics

Temporal stability [1/decade]:


abs

rel


Weighted least square:

None


Ordinary least square:

None


Probabilities that GCOS criteria is met:

Weighted least square:

None %

Ordinary least square:

None %


DHR statistics

Temporal stability [1/decade]:


abs

rel


Weighted least square:

None


Ordinary least square:

None


Probabilities that GCOS criteria is met:

Weighted least square:

None %

Ordinary least square:

None %


Temporal anomaly analyis

The variance of the temporal anomalies provides an additional measure about the stability of the signal AFTER removal of the mean seasonal cylce.

+000 deg


+057/+063 deg