JOBERG


Location

lon / lat [deg]: 28.0292 / -26.1861

Source network: AERONET


Geostationary surface albedo (GSA) data


“+000”


“+057/+063”


Landcover information (based on ESA CCI landcover data)


Landcover fractions @ 2km distance


Landcover fractions @ 20 km distance


Legend


Distance to open water bodies [km]:

5.55

Distance to urban areas [km]:

0.15


Radius: 1 km

Number of landcover classes:

1

Dominant landcover type:

190: urban areas

Fraction of dominant landcover type [%]:

100.0


Radius: 2 km

Number of landcover classes:

1

Dominant landcover type:

190: urban areas

Fraction of dominant landcover type [%]:

100.0


Radius: 5 km

Number of landcover classes:

1

Dominant landcover type:

190: urban areas

Fraction of dominant landcover type [%]:

100.0


Radius: 10 km

Number of landcover classes:

1

Dominant landcover type:

190: urban areas

Fraction of dominant landcover type [%]:

99.0


Radius: 20 km

Number of landcover classes:

3

Dominant landcover type:

190: urban areas

Fraction of dominant landcover type [%]:

90.0


Disturbances


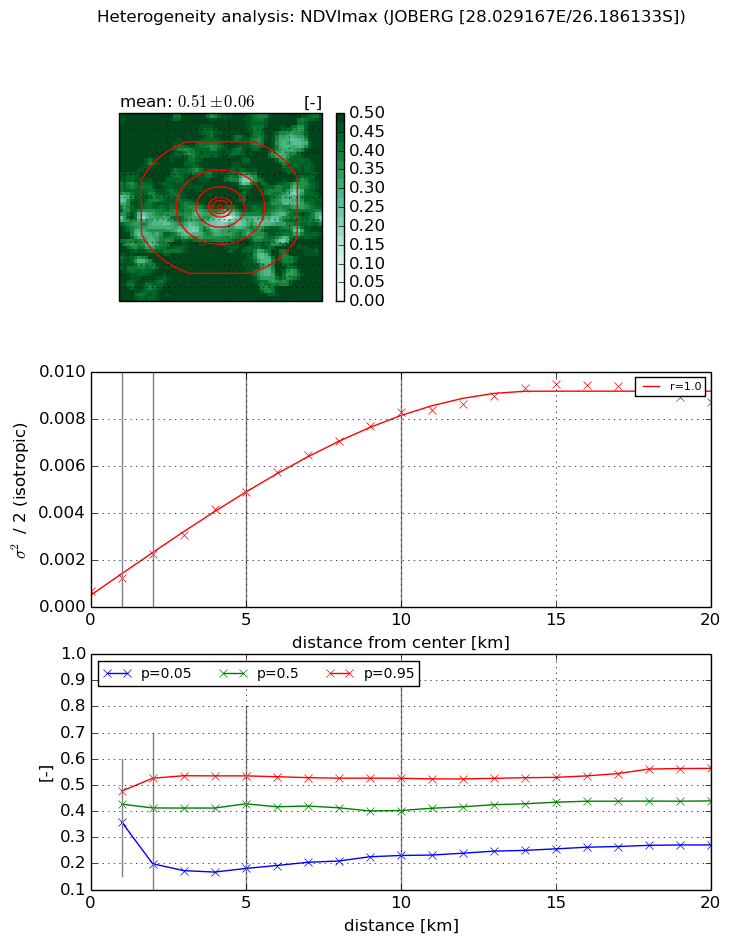
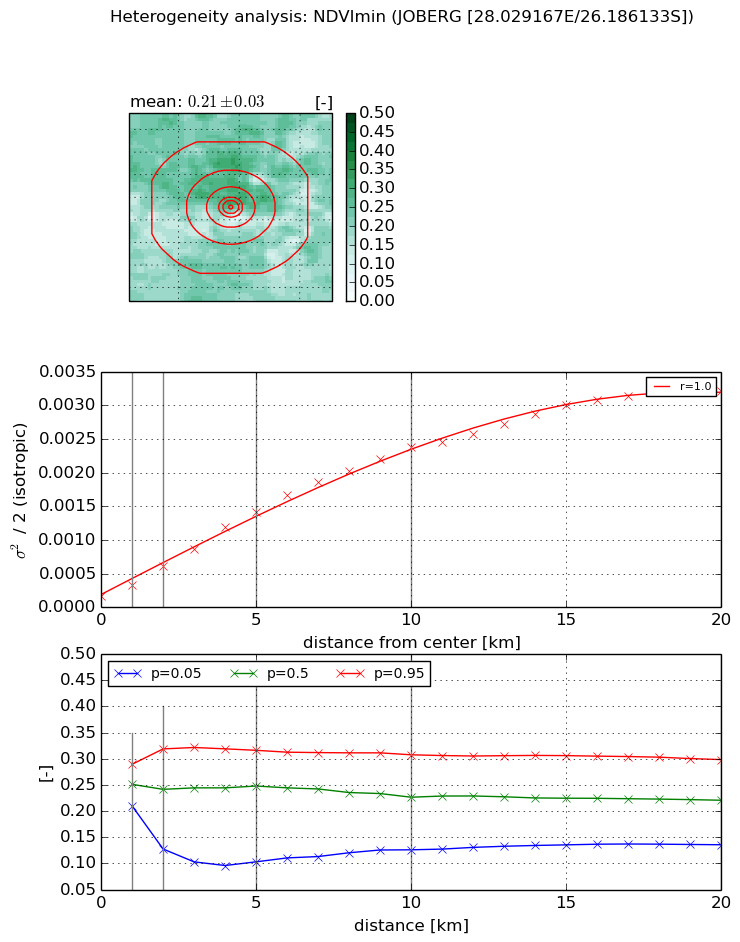
Heterogeneity analysis

The heterogeneity analysis provides information about the spatial and temporal heterogeneity of the site.

Topography


Roman et al. (2009) index


St

6.25865249909

Rcv

0.179064044627

Rse

0.0

Rst

-0.045723298877

Rsv

-0.254549063244


Height range @ 1km [m]

68

Height range @ 2km [m]

106

Height range @ 5km [m]

157

Height range @ 10km [m]

-999

Height range @ 20km [m]

-999


Variance slope @ 1 km

505

Variance slope @ 2 km

524

Variance slope @ 5 km

531

Variance slope @ 10 km

-999

Variance slope @ 20 km

-999


NDVI (max. NDVI composite)


Roman et al. (2009) index


St

5.10199101959

Rcv

0.019833694509

Rse

0.0

Rst

0.00341090671814

Rsv

0.564761137803


NDVI range @ 1km [-]

0.12

NDVI range @ 2km [-]

0.33

NDVI range @ 5km [-]

0.35

NDVI range @ 10km [-]

0.3

NDVI range @ 20km [-]

0.29


Variance slope @ 1 km

0.000586479684865

Variance slope @ 2 km

0.000794465623336

Variance slope @ 5 km

0.00087436120993

Variance slope @ 10 km

0.000788265885239

Variance slope @ 20 km

0.000428084831288


NDVI (min. NDVI composite)I


Roman et al. (2009) index


St

3.36688925012

Rcv

0.0564001762338

Rse

0.0

Rst

-0.299803849706

Rsv

0.534826173493


NDVI range @ 1km [-]

0.08

NDVI range @ 2km [-]

0.19

NDVI range @ 5km [-]

0.21

NDVI range @ 10km [-]

0.18

NDVI range @ 20km [-]

0.16


NDVI slope @ 1 km

0.000159067877027

NDVI slope @ 2 km

0.000223052811369

NDVI slope @ 5 km

0.000259040053881

NDVI slope @ 10 km

0.000229046363435

NDVI slope @ 20 km

0.000157461318945


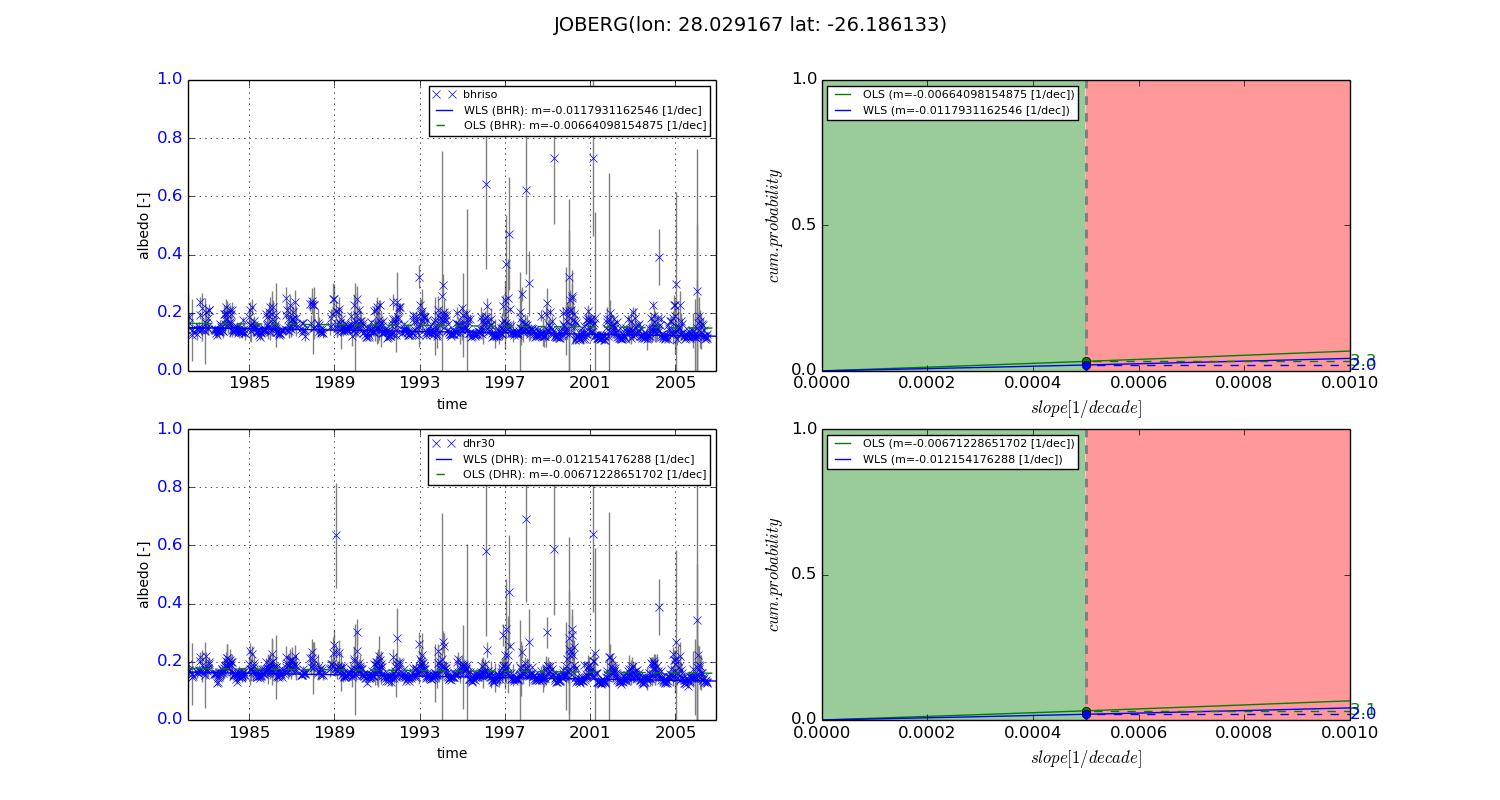
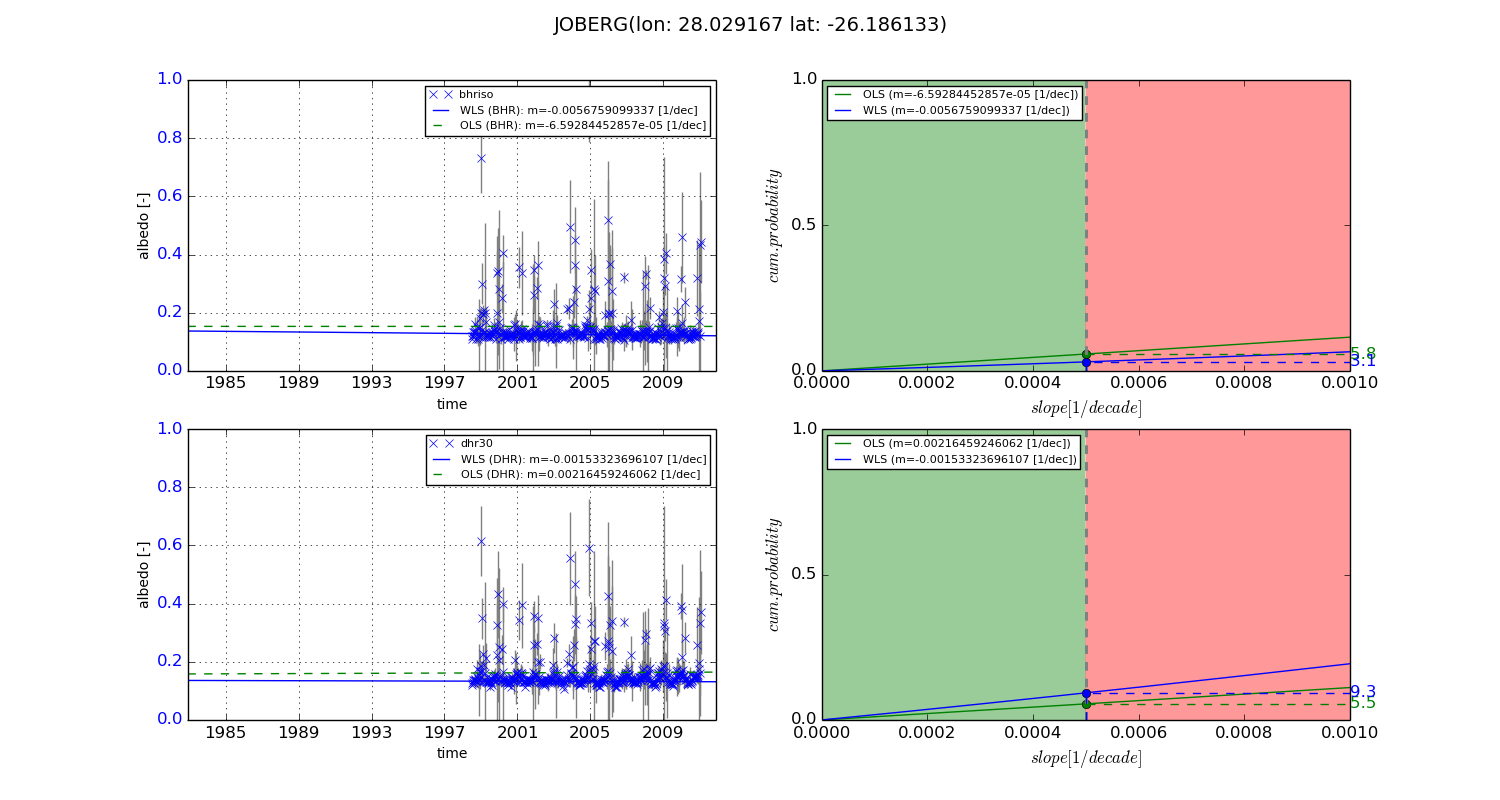
Temporal stability analysis

+000 deg (BHR)


BHR statistics

Temporal stability [1/decade]:


abs

rel


Weighted least square:

-0.0117931162546


Ordinary least square:

-0.00664098154875


Probabilities that GCOS criteria is met:

Weighted least square:

2.0 %

Ordinary least square:

3.3 %


DHR statistics

Temporal stability [1/decade]:


abs

rel


Weighted least square:

-0.012154176288


Ordinary least square:

-0.00671228651702


Probabilities that GCOS criteria is met:

Weighted least square:

2.0 %

Ordinary least square:

3.1 %


+057/+063 deg (BHR)


BHR statistics

Temporal stability [1/decade]:


abs

rel


Weighted least square:

-0.0056759099337


Ordinary least square:

-6.59284452857e-05


Probabilities that GCOS criteria is met:

Weighted least square:

3.1 %

Ordinary least square:

5.8 %


DHR statistics

Temporal stability [1/decade]:


abs

rel


Weighted least square:

-0.00153323696107


Ordinary least square:

0.00216459246062


Probabilities that GCOS criteria is met:

Weighted least square:

9.3 %

Ordinary least square:

5.5 %


Temporal anomaly analyis

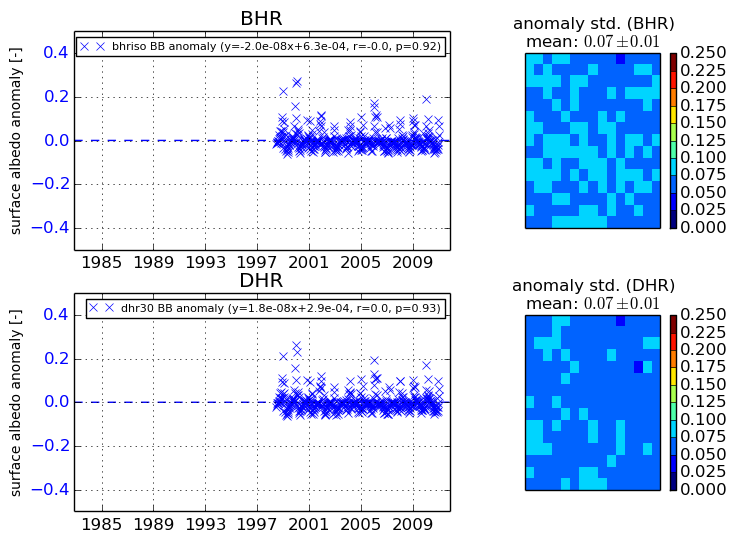
The variance of the temporal anomalies provides an additional measure about the stability of the signal AFTER removal of the mean seasonal cylce.
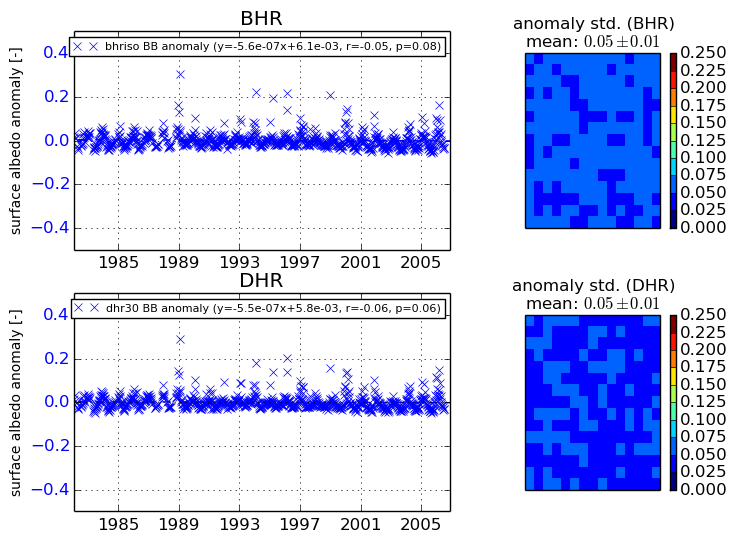
+000 deg


+057/+063 deg