JOMSOM


Location

lon / lat [deg]: 83.7142 / 28.7782

Source network: AERONET


Geostationary surface albedo (GSA) data


“+000”


“+057/+063”


Landcover information (based on ESA CCI landcover data)


Landcover fractions @ 2km distance


Landcover fractions @ 20 km distance


Legend


Distance to open water bodies [km]:

8.0

Distance to urban areas [km]:

4.98


Radius: 1 km

Number of landcover classes:

4

Dominant landcover type:

130: grassland

Fraction of dominant landcover type [%]:

92.0


Radius: 2 km

Number of landcover classes:

5

Dominant landcover type:

130: grassland

Fraction of dominant landcover type [%]:

92.0


Radius: 5 km

Number of landcover classes:

3

Dominant landcover type:

130: grassland

Fraction of dominant landcover type [%]:

71.0


Radius: 10 km

Number of landcover classes:

4

Dominant landcover type:

130: grassland

Fraction of dominant landcover type [%]:

66.0


Radius: 20 km

Number of landcover classes:

6

Dominant landcover type:

130: grassland

Fraction of dominant landcover type [%]:

61.0


Disturbances


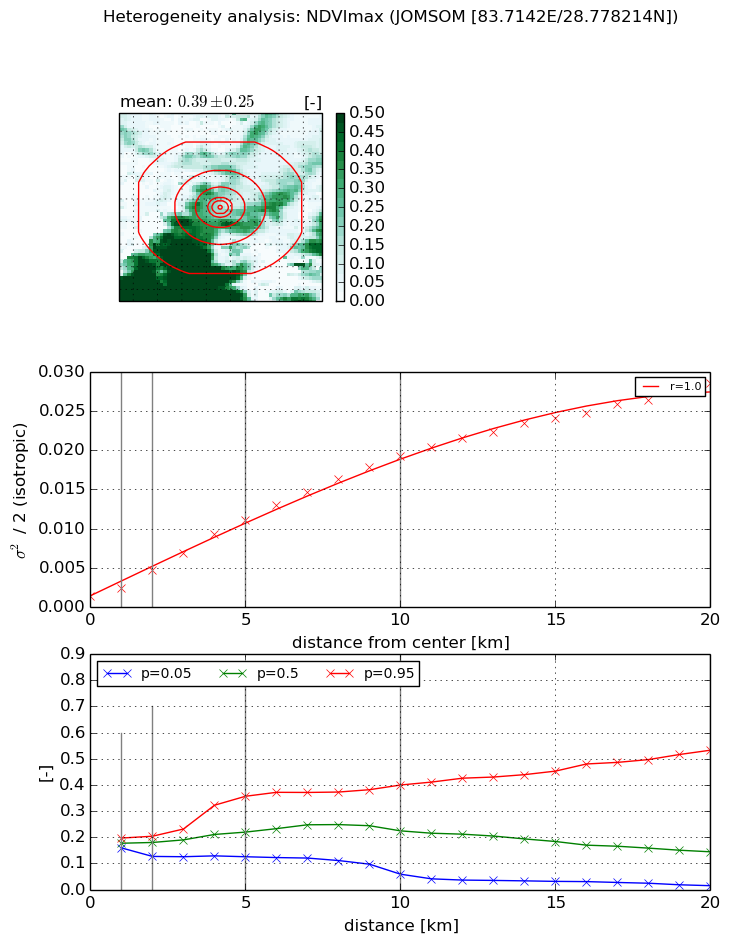
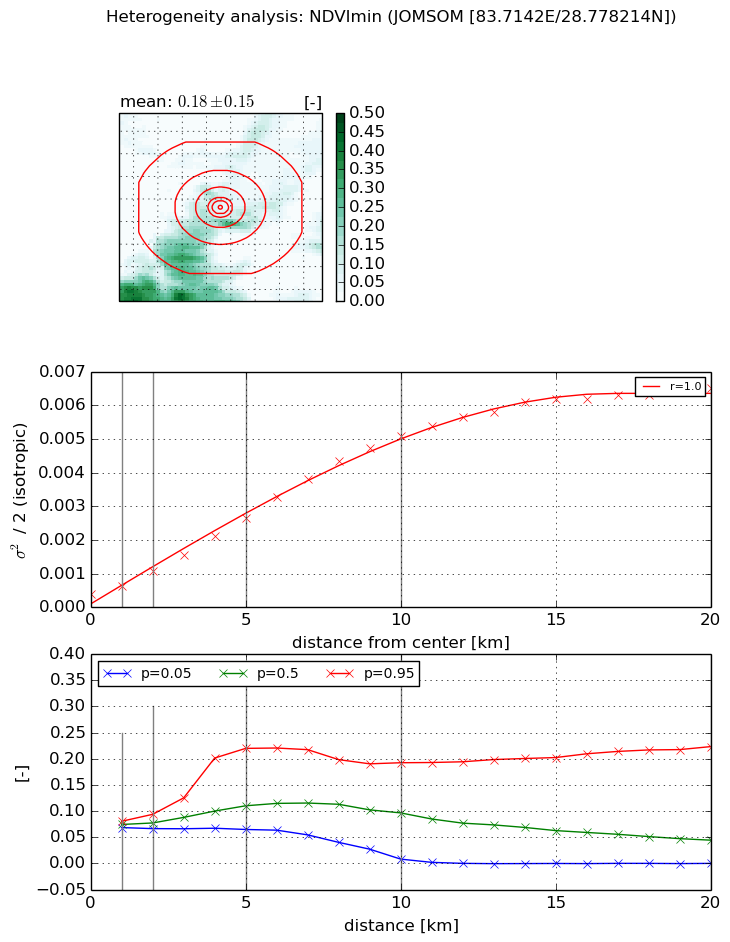
Heterogeneity analysis

The heterogeneity analysis provides information about the spatial and temporal heterogeneity of the site.

Topography


Roman et al. (2009) index


St

5.27747356512

Rcv

0.286020894426

Rse

0.0

Rst

0.00684707940382

Rsv

0.275585844647


Height range @ 1km [m]

255

Height range @ 2km [m]

634

Height range @ 5km [m]

1283

Height range @ 10km [m]

-999

Height range @ 20km [m]

-999


Variance slope @ 1 km

48566

Variance slope @ 2 km

63610

Variance slope @ 5 km

52821

Variance slope @ 10 km

-999

Variance slope @ 20 km

-999


NDVI (max. NDVI composite)


Roman et al. (2009) index


St

1.09063046531

Rcv

0.744431957849

Rse

0.0

Rst

0.00331173003975

Rsv

2.00295886024


NDVI range @ 1km [-]

0.04

NDVI range @ 2km [-]

0.08

NDVI range @ 5km [-]

0.23

NDVI range @ 10km [-]

0.34

NDVI range @ 20km [-]

0.52


Variance slope @ 1 km

0.00111513324916

Variance slope @ 2 km

0.0016977811039

Variance slope @ 5 km

0.00204058942

Variance slope @ 10 km

0.00186034498406

Variance slope @ 20 km

0.00134962971076


NDVI (min. NDVI composite)I


Roman et al. (2009) index


St

1.25970032452e-07

Rcv

0.926155442631

Rse

0.0

Rst

0.294841163268

Rsv

23815186.7376


NDVI range @ 1km [-]

0.01

NDVI range @ 2km [-]

0.03

NDVI range @ 5km [-]

0.16

NDVI range @ 10km [-]

0.18

NDVI range @ 20km [-]

0.22


NDVI slope @ 1 km

0.00023637325207

NDVI slope @ 2 km

0.000342619601694

NDVI slope @ 5 km

0.000462172518539

NDVI slope @ 10 km

0.000502072036943

NDVI slope @ 20 km

0.000325899718136


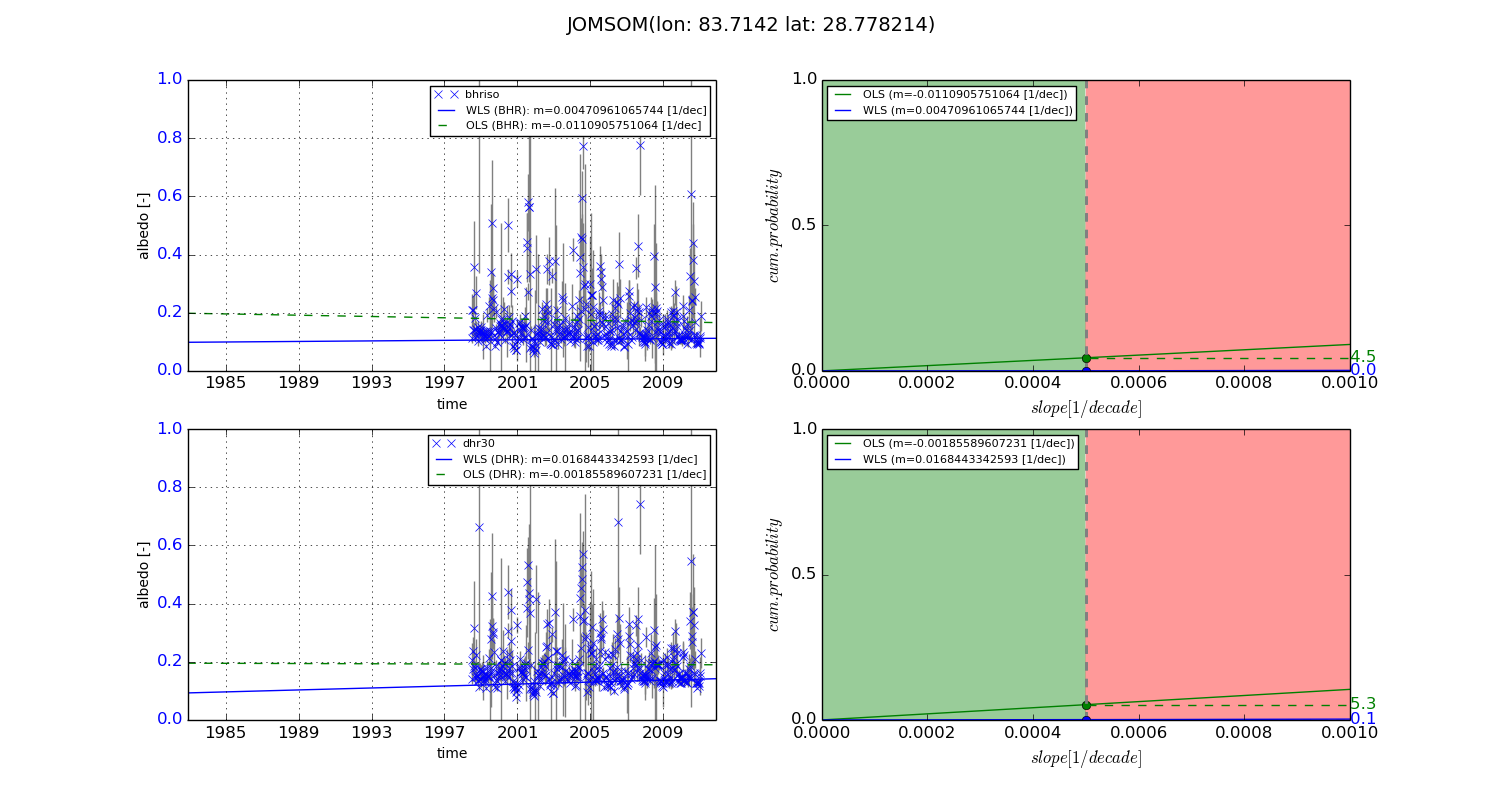
Temporal stability analysis

+000 deg (BHR)


BHR statistics

Temporal stability [1/decade]:


abs

rel


Weighted least square:

None


Ordinary least square:

None


Probabilities that GCOS criteria is met:

Weighted least square:

None %

Ordinary least square:

None %


DHR statistics

Temporal stability [1/decade]:


abs

rel


Weighted least square:

None


Ordinary least square:

None


Probabilities that GCOS criteria is met:

Weighted least square:

None %

Ordinary least square:

None %


+057/+063 deg (BHR)


BHR statistics

Temporal stability [1/decade]:


abs

rel


Weighted least square:

0.00470961065744


Ordinary least square:

-0.0110905751064


Probabilities that GCOS criteria is met:

Weighted least square:

0.0 %

Ordinary least square:

4.5 %


DHR statistics

Temporal stability [1/decade]:


abs

rel


Weighted least square:

0.0168443342593


Ordinary least square:

-0.00185589607231


Probabilities that GCOS criteria is met:

Weighted least square:

0.1 %

Ordinary least square:

5.3 %


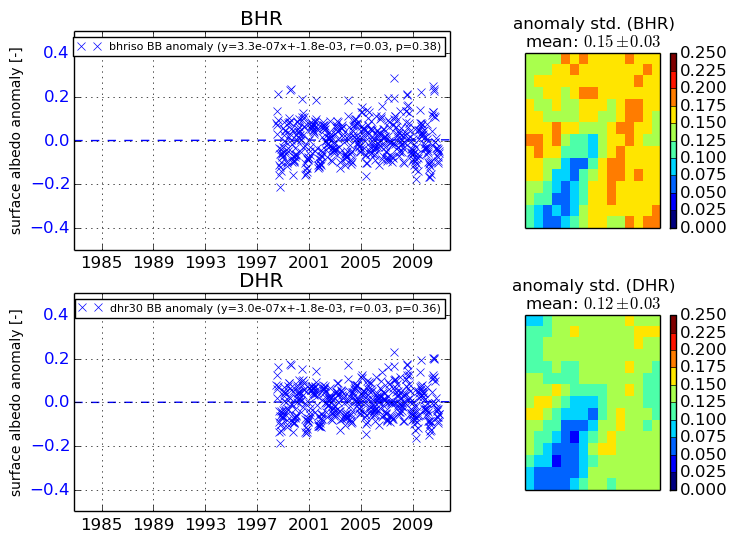
Temporal anomaly analyis

The variance of the temporal anomalies provides an additional measure about the stability of the signal AFTER removal of the mean seasonal cylce.

+000 deg


+057/+063 deg