JORNADA1


Location

lon / lat [deg]: -106.86 / 32.6

Source network: EOS_LAND


Geostationary surface albedo (GSA) data


“+000”


“+057/+063”


Landcover information (based on ESA CCI landcover data)


Landcover fractions @ 2km distance


Landcover fractions @ 20 km distance


Legend


Distance to open water bodies [km]:

12.91

Distance to urban areas [km]:

11.96


Radius: 1 km

Number of landcover classes:

1

Dominant landcover type:

120: Shrubland

Fraction of dominant landcover type [%]:

100.0


Radius: 2 km

Number of landcover classes:

1

Dominant landcover type:

120: Shrubland

Fraction of dominant landcover type [%]:

100.0


Radius: 5 km

Number of landcover classes:

1

Dominant landcover type:

120: Shrubland

Fraction of dominant landcover type [%]:

100.0


Radius: 10 km

Number of landcover classes:

1

Dominant landcover type:

120: Shrubland

Fraction of dominant landcover type [%]:

100.0


Radius: 20 km

Number of landcover classes:

3

Dominant landcover type:

120: Shrubland

Fraction of dominant landcover type [%]:

96.0


Disturbances


Heterogeneity analysis

The heterogeneity analysis provides information about the spatial and temporal heterogeneity of the site.

Topography


Roman et al. (2009) index


St

11.5616795705

Rcv

-0.181742448268

Rse

0.0

Rst

-0.0570720233191

Rsv

-0.0206633994018


Height range @ 1km [m]

10

Height range @ 2km [m]

17

Height range @ 5km [m]

13

Height range @ 10km [m]

-999

Height range @ 20km [m]

-999


Variance slope @ 1 km

7

Variance slope @ 2 km

5

Variance slope @ 5 km

3

Variance slope @ 10 km

-999

Variance slope @ 20 km

-999


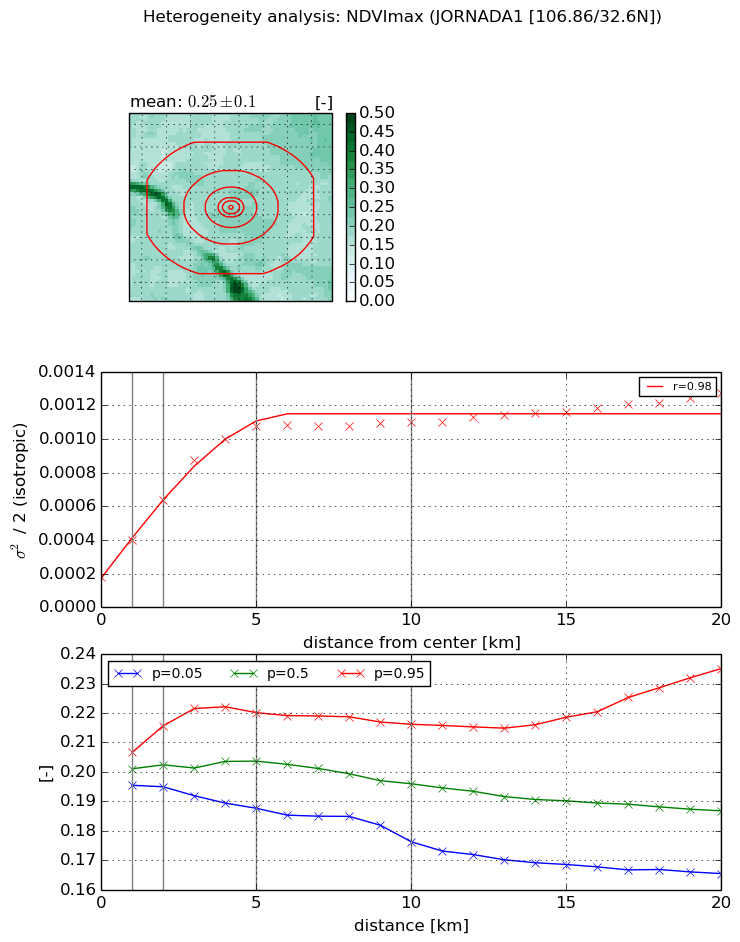
NDVI (max. NDVI composite)


Roman et al. (2009) index


St

1.27137947036

Rcv

0.0275840150335

Rse

0.0

Rst

-2.01934670679e-08

Rsv

2.33205765315


NDVI range @ 1km [-]

0.01

NDVI range @ 2km [-]

0.02

NDVI range @ 5km [-]

0.03

NDVI range @ 10km [-]

0.04

NDVI range @ 20km [-]

0.07


Variance slope @ 1 km

0.000222276619147

Variance slope @ 2 km

0.000229624552136

Variance slope @ 5 km

0.000187137884381

Variance slope @ 10 km

8.38427576368e-05

Variance slope @ 20 km

3.60138493411e-05


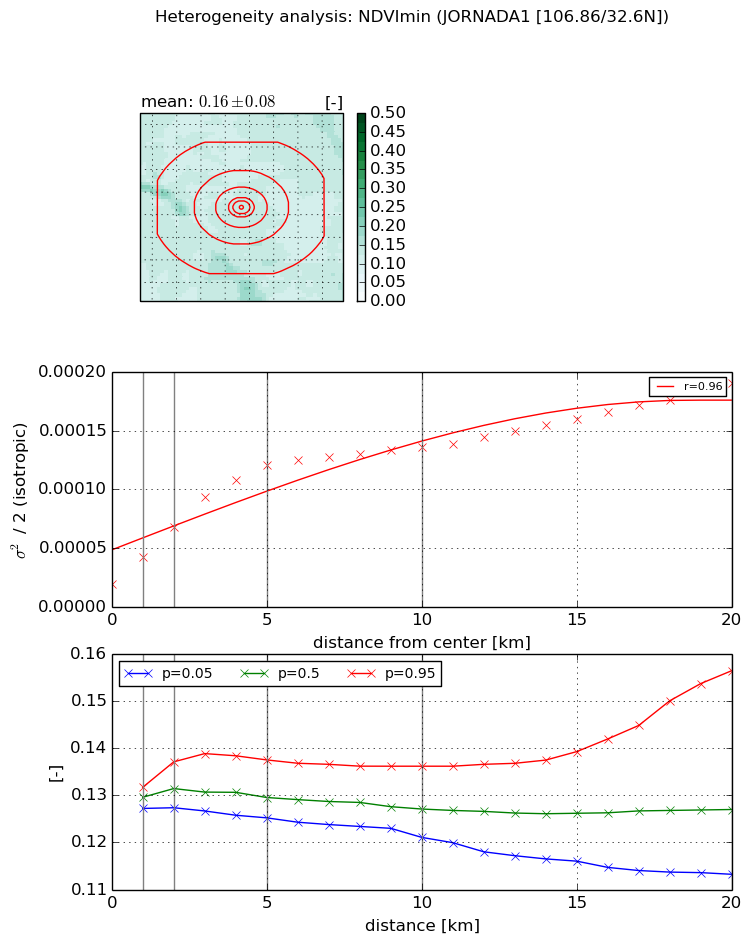
NDVI (min. NDVI composite)I


Roman et al. (2009) index


St

1.12038222543e-07

Rcv

-0.0855714085011

Rse

0.0

Rst

0.202914270984

Rsv

26776575.8827


NDVI range @ 1km [-]

0.0

NDVI range @ 2km [-]

0.01

NDVI range @ 5km [-]

0.01

NDVI range @ 10km [-]

0.02

NDVI range @ 20km [-]

0.04


NDVI slope @ 1 km

2.31217972441e-05

NDVI slope @ 2 km

2.40517773413e-05

NDVI slope @ 5 km

2.07098606797e-05

NDVI slope @ 10 km

1.10908488127e-05

NDVI slope @ 20 km

6.69118395695e-06


Temporal stability analysis

+000 deg (BHR)


BHR statistics

Temporal stability [1/decade]:


abs

rel


Weighted least square:

None


Ordinary least square:

None


Probabilities that GCOS criteria is met:

Weighted least square:

None %

Ordinary least square:

None %


DHR statistics

Temporal stability [1/decade]:


abs

rel


Weighted least square:

None


Ordinary least square:

None


Probabilities that GCOS criteria is met:

Weighted least square:

None %

Ordinary least square:

None %


+057/+063 deg (BHR)


BHR statistics

Temporal stability [1/decade]:


abs

rel


Weighted least square:

None


Ordinary least square:

None


Probabilities that GCOS criteria is met:

Weighted least square:

None %

Ordinary least square:

None %


DHR statistics

Temporal stability [1/decade]:


abs

rel


Weighted least square:

None


Ordinary least square:

None


Probabilities that GCOS criteria is met:

Weighted least square:

None %

Ordinary least square:

None %


Temporal anomaly analyis

The variance of the temporal anomalies provides an additional measure about the stability of the signal AFTER removal of the mean seasonal cylce.

+000 deg


+057/+063 deg