JORNADA_BASIN_LTER_JRN


Location

lon / lat [deg]: -106.74 / 32.62

Source network: LTER


Geostationary surface albedo (GSA) data


“+000”


“+057/+063”


Landcover information (based on ESA CCI landcover data)


Landcover fractions @ 2km distance


Landcover fractions @ 20 km distance


Legend


Distance to open water bodies [km]:

22.13

Distance to urban areas [km]:

16.69


Radius: 1 km

Number of landcover classes:

1

Dominant landcover type:

120: Shrubland

Fraction of dominant landcover type [%]:

100.0


Radius: 2 km

Number of landcover classes:

1

Dominant landcover type:

120: Shrubland

Fraction of dominant landcover type [%]:

100.0


Radius: 5 km

Number of landcover classes:

1

Dominant landcover type:

120: Shrubland

Fraction of dominant landcover type [%]:

100.0


Radius: 10 km

Number of landcover classes:

1

Dominant landcover type:

120: Shrubland

Fraction of dominant landcover type [%]:

100.0


Radius: 20 km

Number of landcover classes:

1

Dominant landcover type:

120: Shrubland

Fraction of dominant landcover type [%]:

99.0


Disturbances


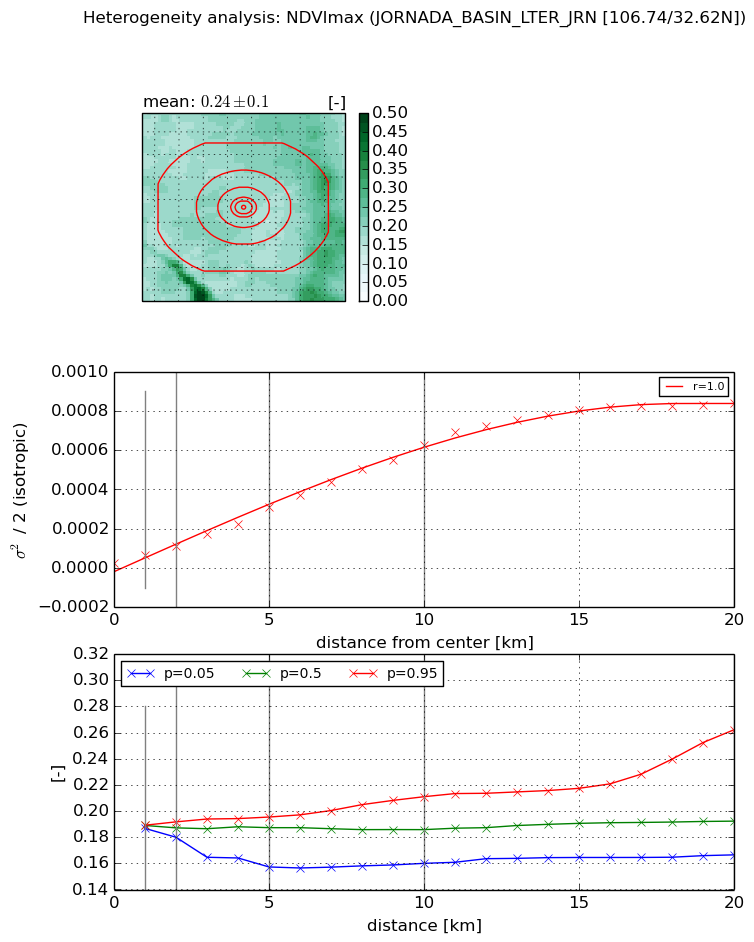
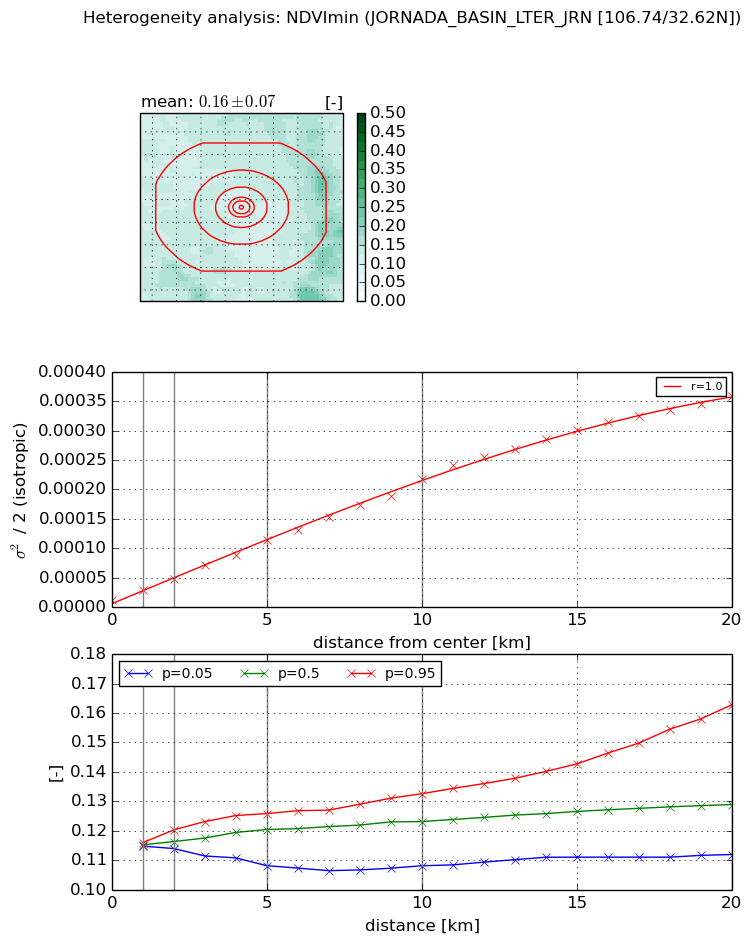
Heterogeneity analysis

The heterogeneity analysis provides information about the spatial and temporal heterogeneity of the site.

Topography


Roman et al. (2009) index


St

0.000579787325316

Rcv

0.520253377155

Rse

0.0

Rst

2.66505961698e-05

Rsv

5173.790832


Height range @ 1km [m]

11

Height range @ 2km [m]

14

Height range @ 5km [m]

29

Height range @ 10km [m]

-999

Height range @ 20km [m]

-999


Variance slope @ 1 km

12

Variance slope @ 2 km

15

Variance slope @ 5 km

23

Variance slope @ 10 km

-999

Variance slope @ 20 km

-999


NDVI (max. NDVI composite)


Roman et al. (2009) index


St

1.49771773125

Rcv

0.365346325445

Rse

0.0

Rst

-1.35370349717

Rsv

-0.283997839442


NDVI range @ 1km [-]

0.0

NDVI range @ 2km [-]

0.01

NDVI range @ 5km [-]

0.04

NDVI range @ 10km [-]

0.05

NDVI range @ 20km [-]

0.1


Variance slope @ 1 km

3.9495938831e-05

Variance slope @ 2 km

4.17016586015e-05

Variance slope @ 5 km

5.63813078728e-05

Variance slope @ 10 km

6.17767209409e-05

Variance slope @ 20 km

4.48834079777e-05


NDVI (min. NDVI composite)I


Roman et al. (2009) index


St

4.65101407716

Rcv

0.470006512449

Rse

0.0

Rst

-0.0564889794368

Rsv

0.118525131623


NDVI range @ 1km [-]

0.0

NDVI range @ 2km [-]

0.01

NDVI range @ 5km [-]

0.02

NDVI range @ 10km [-]

0.02

NDVI range @ 20km [-]

0.05


NDVI slope @ 1 km

1.77537334461e-05

NDVI slope @ 2 km

1.8061729156e-05

NDVI slope @ 5 km

2.03722260634e-05

NDVI slope @ 10 km

2.04281989004e-05

NDVI slope @ 20 km

1.79654210706e-05


Temporal stability analysis

+000 deg (BHR)


BHR statistics

Temporal stability [1/decade]:


abs

rel


Weighted least square:

None


Ordinary least square:

None


Probabilities that GCOS criteria is met:

Weighted least square:

None %

Ordinary least square:

None %


DHR statistics

Temporal stability [1/decade]:


abs

rel


Weighted least square:

None


Ordinary least square:

None


Probabilities that GCOS criteria is met:

Weighted least square:

None %

Ordinary least square:

None %


+057/+063 deg (BHR)


BHR statistics

Temporal stability [1/decade]:


abs

rel


Weighted least square:

None


Ordinary least square:

None


Probabilities that GCOS criteria is met:

Weighted least square:

None %

Ordinary least square:

None %


DHR statistics

Temporal stability [1/decade]:


abs

rel


Weighted least square:

None


Ordinary least square:

None


Probabilities that GCOS criteria is met:

Weighted least square:

None %

Ordinary least square:

None %


Temporal anomaly analyis

The variance of the temporal anomalies provides an additional measure about the stability of the signal AFTER removal of the mean seasonal cylce.

+000 deg


+057/+063 deg