JP-MAS


Location

lon / lat [deg]: 140.0269 / 36.054

Source network: FLUXNET


Geostationary surface albedo (GSA) data


“+000”


“+057/+063”


Landcover information (based on ESA CCI landcover data)


Landcover fractions @ 2km distance


Landcover fractions @ 20 km distance


Legend


Distance to open water bodies [km]:

8.55

Distance to urban areas [km]:

1.86


Radius: 1 km

Number of landcover classes:

3

Dominant landcover type:

11: cropland, rainfed, herbaceous cover

Fraction of dominant landcover type [%]:

86.0


Radius: 2 km

Number of landcover classes:

5

Dominant landcover type:

11: cropland, rainfed, herbaceous cover

Fraction of dominant landcover type [%]:

91.0


Radius: 5 km

Number of landcover classes:

4

Dominant landcover type:

11: cropland, rainfed, herbaceous cover

Fraction of dominant landcover type [%]:

81.0


Radius: 10 km

Number of landcover classes:

4

Dominant landcover type:

11: cropland, rainfed, herbaceous cover

Fraction of dominant landcover type [%]:

82.0


Radius: 20 km

Number of landcover classes:

6

Dominant landcover type:

11: cropland, rainfed, herbaceous cover

Fraction of dominant landcover type [%]:

63.0


Disturbances


Heterogeneity analysis

The heterogeneity analysis provides information about the spatial and temporal heterogeneity of the site.

Topography


Roman et al. (2009) index


St

10.4969462519

Rcv

-0.0214173848511

Rse

0.0

Rst

-0.105582304582

Rsv

0.158797715642


Height range @ 1km [m]

15

Height range @ 2km [m]

16

Height range @ 5km [m]

19

Height range @ 10km [m]

-999

Height range @ 20km [m]

-999


Variance slope @ 1 km

17

Variance slope @ 2 km

9

Variance slope @ 5 km

7

Variance slope @ 10 km

-999

Variance slope @ 20 km

-999


NDVI (max. NDVI composite)


Roman et al. (2009) index


St

1.32847090234

Rcv

0.3434836149

Rse

0.0

Rst

0.0916411733683

Rsv

1.82311059703


NDVI range @ 1km [-]

0.03

NDVI range @ 2km [-]

0.07

NDVI range @ 5km [-]

0.12

NDVI range @ 10km [-]

0.15

NDVI range @ 20km [-]

0.2


Variance slope @ 1 km

0.000634358513538

Variance slope @ 2 km

0.000648289538138

Variance slope @ 5 km

0.000482899657774

Variance slope @ 10 km

0.000273904743469

Variance slope @ 20 km

0.000173961984497


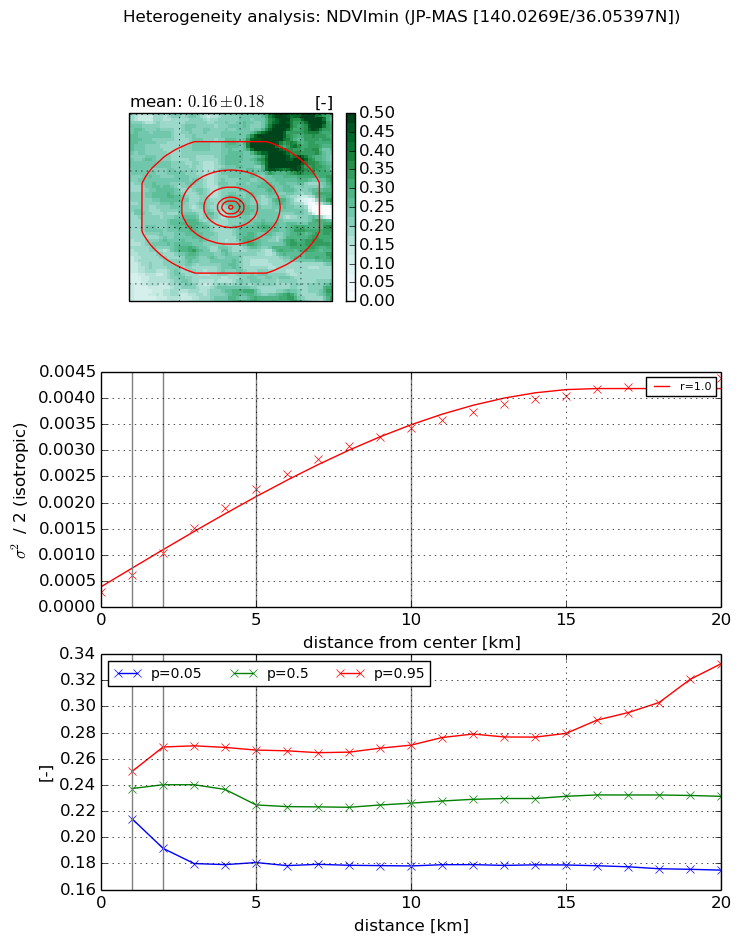
NDVI (min. NDVI composite)I


Roman et al. (2009) index


St

2.22437739802e-07

Rcv

-0.0795851438344

Rse

0.0

Rst

0.304558408696

Rsv

13486919.6083


NDVI range @ 1km [-]

0.04

NDVI range @ 2km [-]

0.08

NDVI range @ 5km [-]

0.09

NDVI range @ 10km [-]

0.09

NDVI range @ 20km [-]

0.16


NDVI slope @ 1 km

0.000339335595359

NDVI slope @ 2 km

0.000372865338391

NDVI slope @ 5 km

0.000407740641986

NDVI slope @ 10 km

0.00032478934132

NDVI slope @ 20 km

0.000195969162565


Temporal stability analysis

+000 deg (BHR)


BHR statistics

Temporal stability [1/decade]:


abs

rel


Weighted least square:

None


Ordinary least square:

None


Probabilities that GCOS criteria is met:

Weighted least square:

None %

Ordinary least square:

None %


DHR statistics

Temporal stability [1/decade]:


abs

rel


Weighted least square:

None


Ordinary least square:

None


Probabilities that GCOS criteria is met:

Weighted least square:

None %

Ordinary least square:

None %


+057/+063 deg (BHR)


BHR statistics

Temporal stability [1/decade]:


abs

rel


Weighted least square:

None


Ordinary least square:

None


Probabilities that GCOS criteria is met:

Weighted least square:

None %

Ordinary least square:

None %


DHR statistics

Temporal stability [1/decade]:


abs

rel


Weighted least square:

None


Ordinary least square:

None


Probabilities that GCOS criteria is met:

Weighted least square:

None %

Ordinary least square:

None %


Temporal anomaly analyis

The variance of the temporal anomalies provides an additional measure about the stability of the signal AFTER removal of the mean seasonal cylce.

+000 deg


+057/+063 deg