JP-TAK


Location

lon / lat [deg]: 137.423 / 36.1462

Source network: FLUXNET


Geostationary surface albedo (GSA) data


“+000”


“+057/+063”


Landcover information (based on ESA CCI landcover data)


Landcover fractions @ 2km distance


Landcover fractions @ 20 km distance


Legend


Distance to open water bodies [km]:

7.79

Distance to urban areas [km]:

11.47


Radius: 1 km

Number of landcover classes:

2

Dominant landcover type:

70: Tree cover, needleleaved, evergreen, closed to open (>15%)

Fraction of dominant landcover type [%]:

98.0


Radius: 2 km

Number of landcover classes:

3

Dominant landcover type:

70: Tree cover, needleleaved, evergreen, closed to open (>15%)

Fraction of dominant landcover type [%]:

91.0


Radius: 5 km

Number of landcover classes:

3

Dominant landcover type:

70: Tree cover, needleleaved, evergreen, closed to open (>15%)

Fraction of dominant landcover type [%]:

93.0


Radius: 10 km

Number of landcover classes:

6

Dominant landcover type:

70: Tree cover, needleleaved, evergreen, closed to open (>15%)

Fraction of dominant landcover type [%]:

84.0


Radius: 20 km

Number of landcover classes:

8

Dominant landcover type:

70: Tree cover, needleleaved, evergreen, closed to open (>15%)

Fraction of dominant landcover type [%]:

75.0


Disturbances


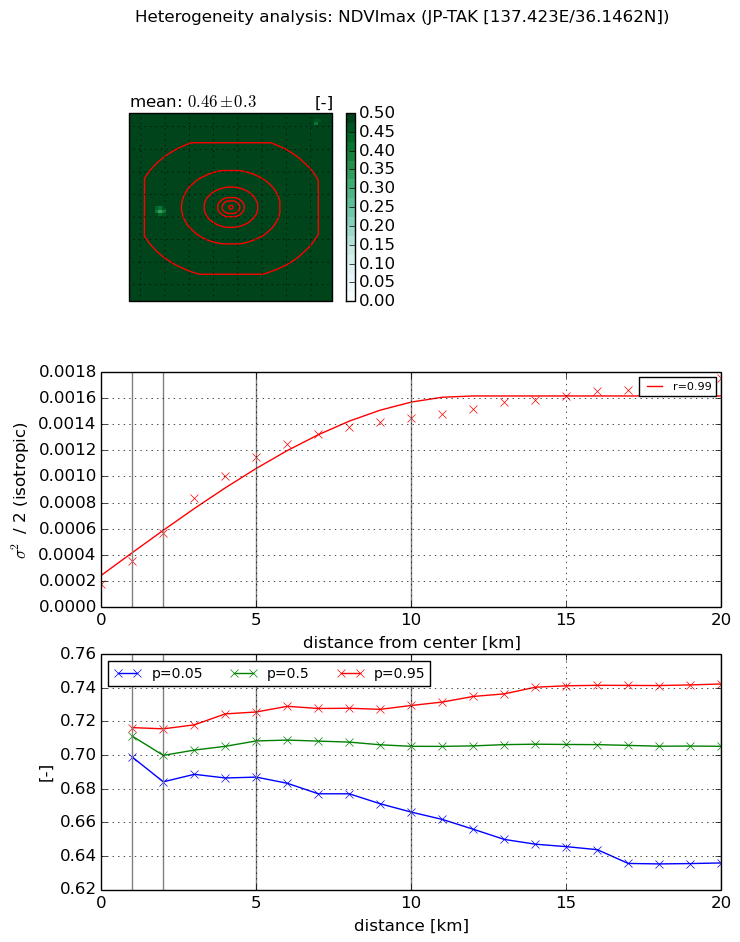
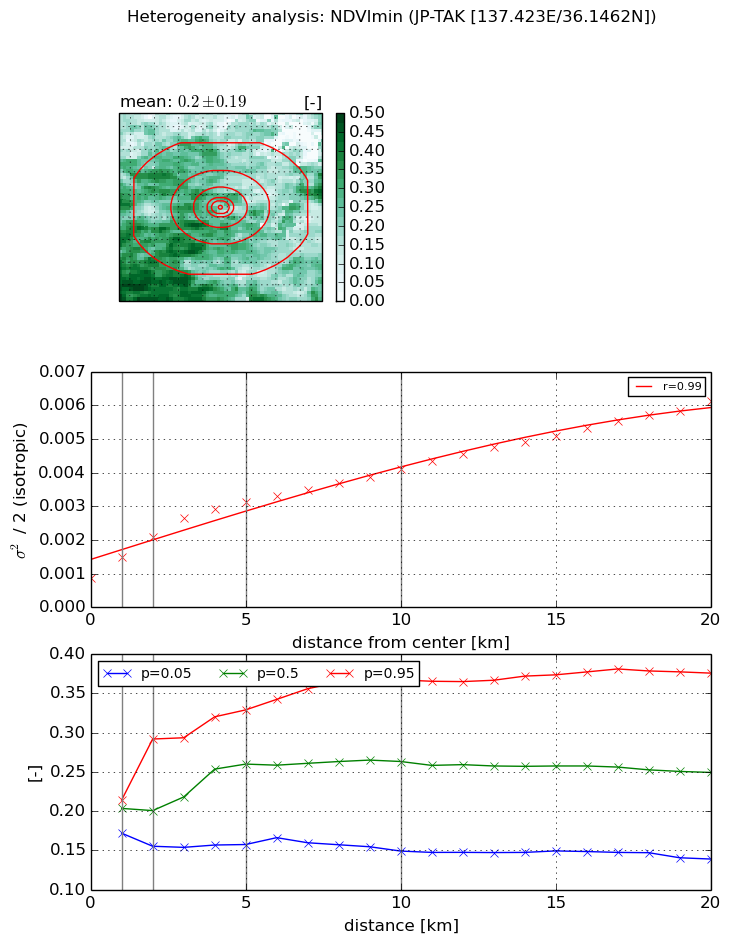
Heterogeneity analysis

The heterogeneity analysis provides information about the spatial and temporal heterogeneity of the site.

Topography


Roman et al. (2009) index


St

3.78068311915

Rcv

0.371248463673

Rse

0.0

Rst

-0.0480569279625

Rsv

0.374201999874


Height range @ 1km [m]

241

Height range @ 2km [m]

413

Height range @ 5km [m]

686

Height range @ 10km [m]

-999

Height range @ 20km [m]

-999


Variance slope @ 1 km

13168

Variance slope @ 2 km

12501

Variance slope @ 5 km

9464

Variance slope @ 10 km

-999

Variance slope @ 20 km

-999


NDVI (max. NDVI composite)


Roman et al. (2009) index


St

0.728247215091

Rcv

0.166585955299

Rse

0.0

Rst

-0.609400547992

Rsv

3.34349371968


NDVI range @ 1km [-]

0.02

NDVI range @ 2km [-]

0.03

NDVI range @ 5km [-]

0.04

NDVI range @ 10km [-]

0.06

NDVI range @ 20km [-]

0.11


Variance slope @ 1 km

0.000176479068954

Variance slope @ 2 km

0.000194691127021

Variance slope @ 5 km

0.0002015826617

Variance slope @ 10 km

0.000129432409062

Variance slope @ 20 km

6.65694344939e-05


NDVI (min. NDVI composite)I


Roman et al. (2009) index


St

4.4839867826

Rcv

-0.07598413933

Rse

0.0

Rst

-0.100590578907

Rsv

0.492472748996


NDVI range @ 1km [-]

0.04

NDVI range @ 2km [-]

0.14

NDVI range @ 5km [-]

0.17

NDVI range @ 10km [-]

0.22

NDVI range @ 20km [-]

0.24


NDVI slope @ 1 km

0.000608088187411

NDVI slope @ 2 km

0.000606316078804

NDVI slope @ 5 km

0.000460487322222

NDVI slope @ 10 km

0.000296738546424

NDVI slope @ 20 km

0.000231532387826


Temporal stability analysis

+000 deg (BHR)


BHR statistics

Temporal stability [1/decade]:


abs

rel


Weighted least square:

None


Ordinary least square:

None


Probabilities that GCOS criteria is met:

Weighted least square:

None %

Ordinary least square:

None %


DHR statistics

Temporal stability [1/decade]:


abs

rel


Weighted least square:

None


Ordinary least square:

None


Probabilities that GCOS criteria is met:

Weighted least square:

None %

Ordinary least square:

None %


+057/+063 deg (BHR)


BHR statistics

Temporal stability [1/decade]:


abs

rel


Weighted least square:

None


Ordinary least square:

None


Probabilities that GCOS criteria is met:

Weighted least square:

None %

Ordinary least square:

None %


DHR statistics

Temporal stability [1/decade]:


abs

rel


Weighted least square:

None


Ordinary least square:

None


Probabilities that GCOS criteria is met:

Weighted least square:

None %

Ordinary least square:

None %


Temporal anomaly analyis

The variance of the temporal anomalies provides an additional measure about the stability of the signal AFTER removal of the mean seasonal cylce.

+000 deg


+057/+063 deg