JUNGFRAU


Location

lon / lat [deg]: 7.9839 / 46.5481

Source network: AERONET


Geostationary surface albedo (GSA) data


“+000”


“+057/+063”


Landcover information (based on ESA CCI landcover data)


Landcover fractions @ 2km distance


Landcover fractions @ 20 km distance


Legend


Distance to open water bodies [km]:

2.09

Distance to urban areas [km]:

6.83


Radius: 1 km

Number of landcover classes:

1

Dominant landcover type:

220: permanent snow and ice

Fraction of dominant landcover type [%]:

100.0


Radius: 2 km

Number of landcover classes:

1

Dominant landcover type:

220: permanent snow and ice

Fraction of dominant landcover type [%]:

100.0


Radius: 5 km

Number of landcover classes:

6

Dominant landcover type:

220: permanent snow and ice

Fraction of dominant landcover type [%]:

75.0


Radius: 10 km

Number of landcover classes:

10

Dominant landcover type:

220: permanent snow and ice

Fraction of dominant landcover type [%]:

55.0


Radius: 20 km

Number of landcover classes:

11

Dominant landcover type:

220: permanent snow and ice

Fraction of dominant landcover type [%]:

37.0


Disturbances


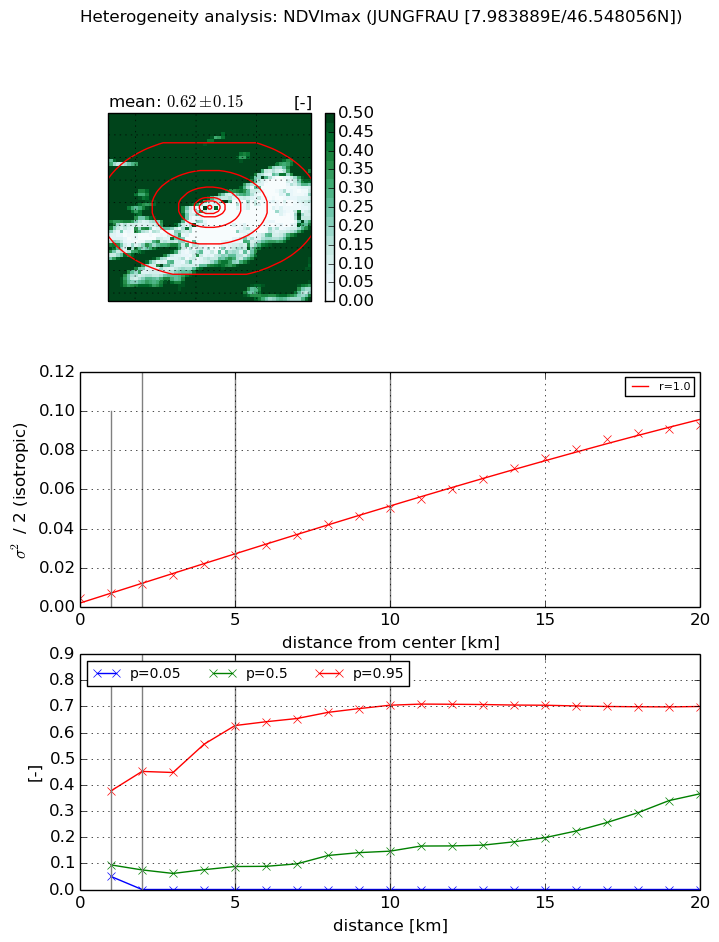
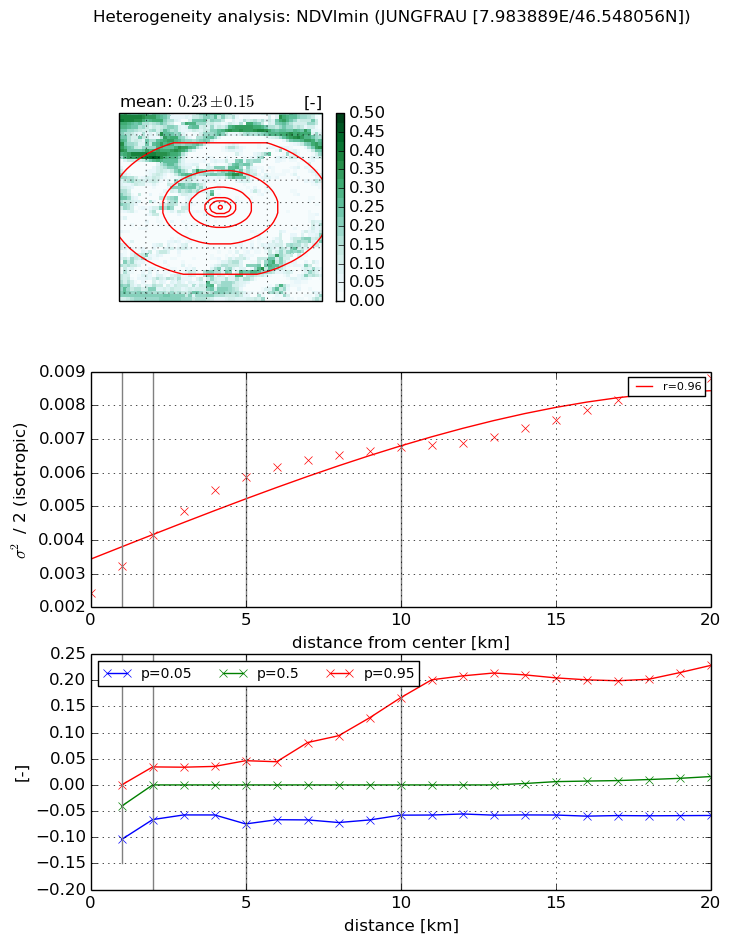
Heterogeneity analysis

The heterogeneity analysis provides information about the spatial and temporal heterogeneity of the site.

Topography


Roman et al. (2009) index


St

3.60991180982

Rcv

0.502853932113

Rse

0.0

Rst

7.56943827836e-10

Rsv

-0.328191299825


Height range @ 1km [m]

678

Height range @ 2km [m]

1002

Height range @ 5km [m]

1900

Height range @ 10km [m]

-999

Height range @ 20km [m]

-999


Variance slope @ 1 km

61427

Variance slope @ 2 km

82779

Variance slope @ 5 km

98585

Variance slope @ 10 km

-999

Variance slope @ 20 km

-999


NDVI (max. NDVI composite)


Roman et al. (2009) index


St

nan

Rcv

nan

Rse

nan

Rst

nan

Rsv

nan


NDVI range @ 1km [-]

0.33

NDVI range @ 2km [-]

0.45

NDVI range @ 5km [-]

0.63

NDVI range @ 10km [-]

0.7

NDVI range @ 20km [-]

0.7


Variance slope @ 1 km

0.00284640143733

Variance slope @ 2 km

0.0036999487296

Variance slope @ 5 km

0.00452348012529

Variance slope @ 10 km

0.00480586460404

Variance slope @ 20 km

0.00471291385428


NDVI (min. NDVI composite)I


Roman et al. (2009) index


St

0.103469889952

Rcv

-27.1282937377

Rse

0.0

Rst

-0.865651671671

Rsv

-0.999996706457


NDVI range @ 1km [-]

0.1

NDVI range @ 2km [-]

0.1

NDVI range @ 5km [-]

0.12

NDVI range @ 10km [-]

0.22

NDVI range @ 20km [-]

0.29


NDVI slope @ 1 km

0.000782909505309

NDVI slope @ 2 km

0.000852577405964

NDVI slope @ 5 km

0.000707067674516

NDVI slope @ 10 km

0.000421397776698

NDVI slope @ 20 km

0.000260375270129


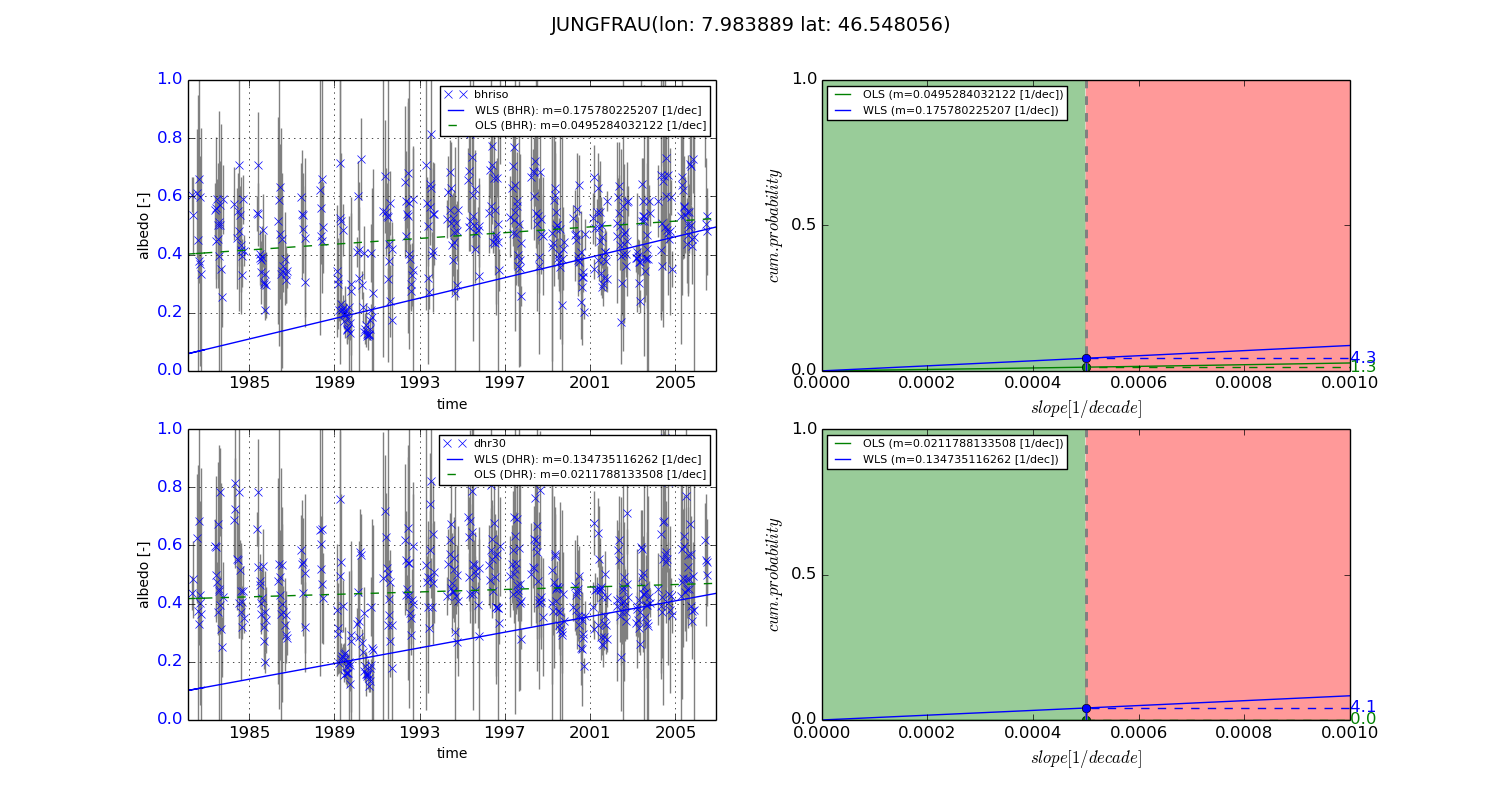
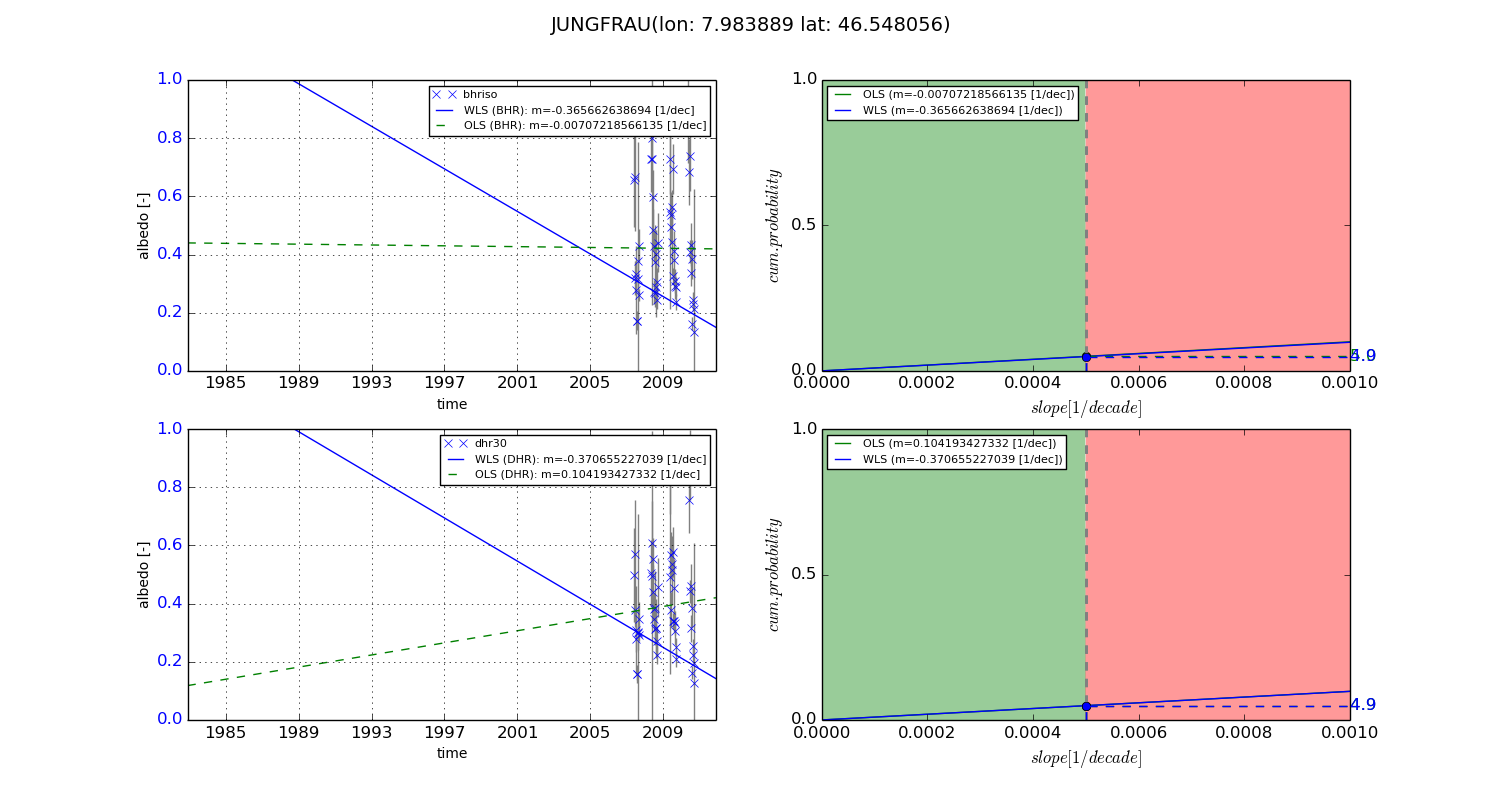
Temporal stability analysis

+000 deg (BHR)


BHR statistics

Temporal stability [1/decade]:


abs

rel


Weighted least square:

0.175780225207


Ordinary least square:

0.0495284032122


Probabilities that GCOS criteria is met:

Weighted least square:

4.3 %

Ordinary least square:

1.3 %


DHR statistics

Temporal stability [1/decade]:


abs

rel


Weighted least square:

0.134735116262


Ordinary least square:

0.0211788133508


Probabilities that GCOS criteria is met:

Weighted least square:

4.1 %

Ordinary least square:

0.0 %


+057/+063 deg (BHR)


BHR statistics

Temporal stability [1/decade]:


abs

rel


Weighted least square:

-0.365662638694


Ordinary least square:

-0.00707218566135


Probabilities that GCOS criteria is met:

Weighted least square:

4.9 %

Ordinary least square:

5.0 %


DHR statistics

Temporal stability [1/decade]:


abs

rel


Weighted least square:

-0.370655227039


Ordinary least square:

0.104193427332


Probabilities that GCOS criteria is met:

Weighted least square:

4.9 %

Ordinary least square:

4.9 %


Temporal anomaly analyis

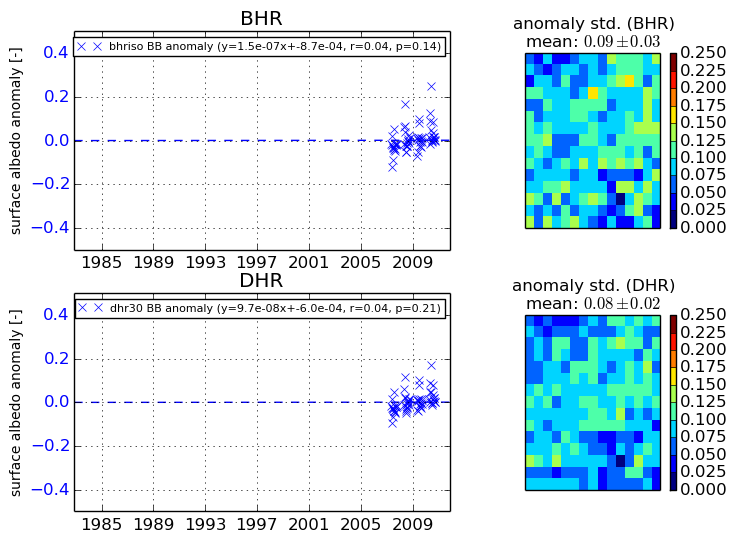
The variance of the temporal anomalies provides an additional measure about the stability of the signal AFTER removal of the mean seasonal cylce.
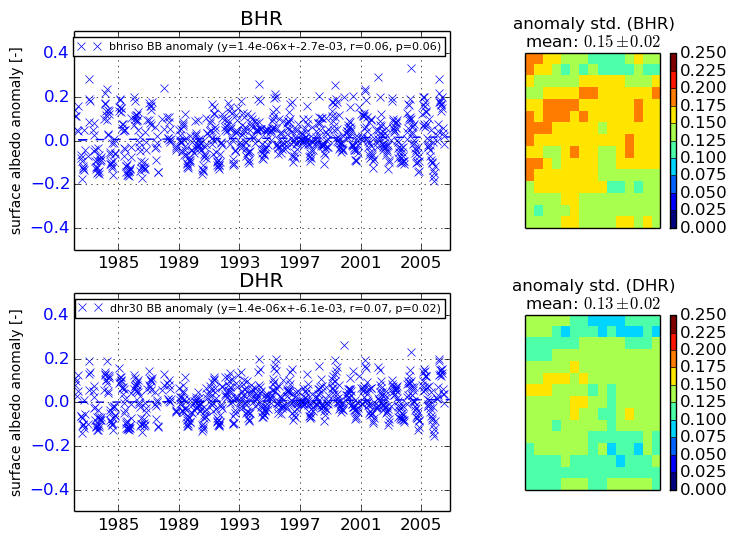
+000 deg


+057/+063 deg