KANDAHAR


Location

lon / lat [deg]: 65.8478 / 31.5086

Source network: AERONET


Geostationary surface albedo (GSA) data


“+000”


“+057/+063”


Landcover information (based on ESA CCI landcover data)


Landcover fractions @ 2km distance


Landcover fractions @ 20 km distance


Legend


Distance to open water bodies [km]:

1.62

Distance to urban areas [km]:

0.15


Radius: 1 km

Number of landcover classes:

3

Dominant landcover type:

200: bare areas

Fraction of dominant landcover type [%]:

50.0


Radius: 2 km

Number of landcover classes:

5

Dominant landcover type:

200: bare areas

Fraction of dominant landcover type [%]:

63.0


Radius: 5 km

Number of landcover classes:

6

Dominant landcover type:

200: bare areas

Fraction of dominant landcover type [%]:

55.0


Radius: 10 km

Number of landcover classes:

6

Dominant landcover type:

200: bare areas

Fraction of dominant landcover type [%]:

58.0


Radius: 20 km

Number of landcover classes:

7

Dominant landcover type:

200: bare areas

Fraction of dominant landcover type [%]:

62.0


Disturbances


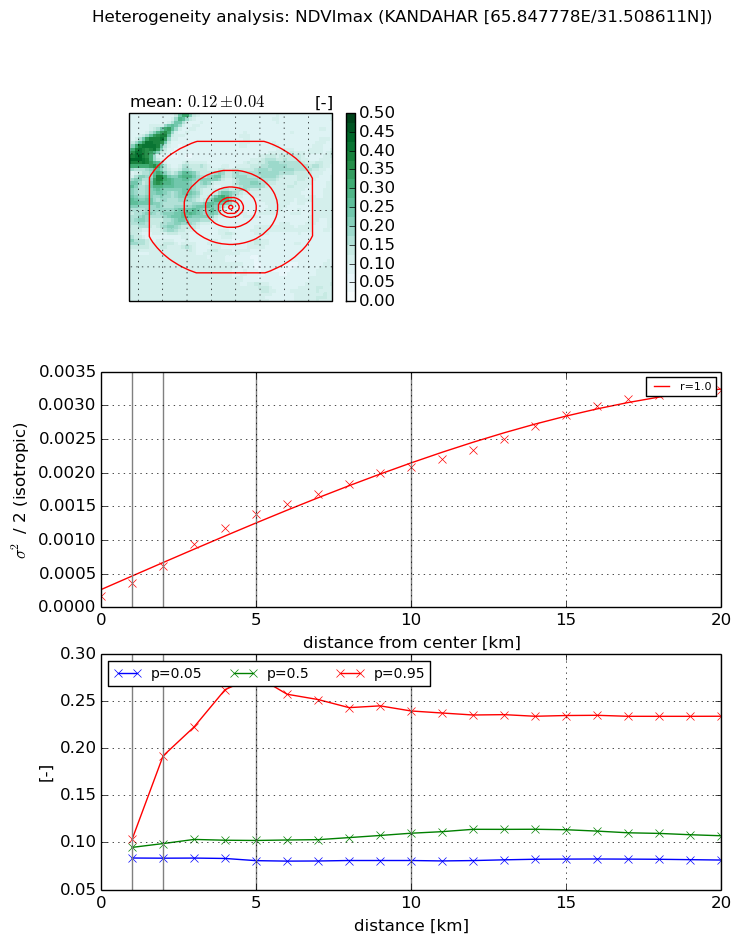
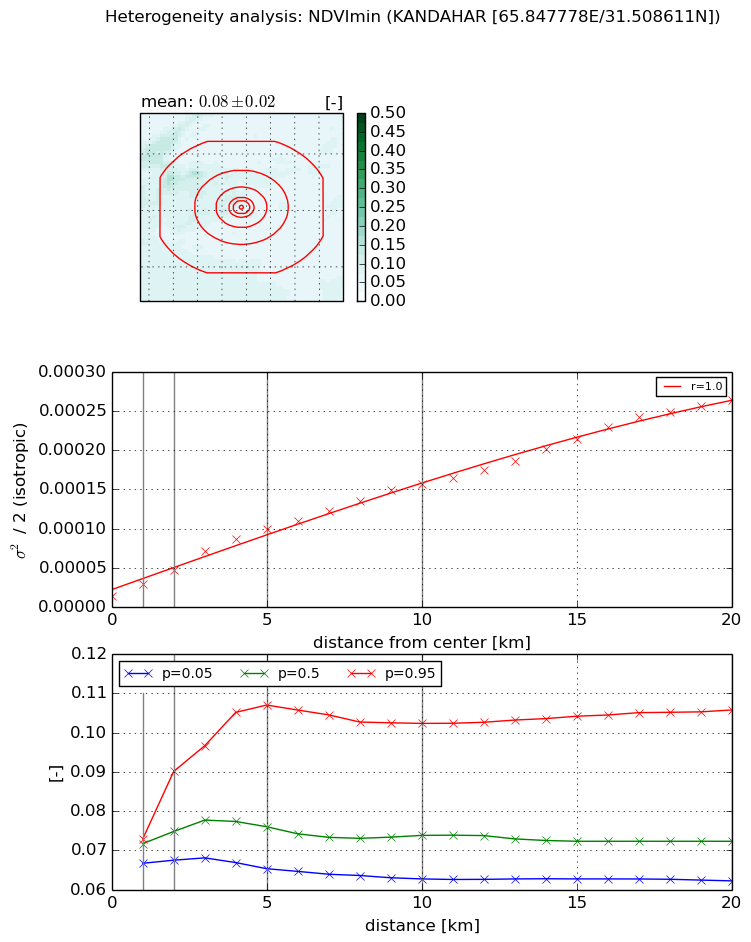
Heterogeneity analysis

The heterogeneity analysis provides information about the spatial and temporal heterogeneity of the site.

Topography


Roman et al. (2009) index


St

4.04542654573

Rcv

0.594009325667

Rse

0.0

Rst

3.22216747541e-06

Rsv

0.147565618543


Height range @ 1km [m]

7

Height range @ 2km [m]

11

Height range @ 5km [m]

26

Height range @ 10km [m]

-999

Height range @ 20km [m]

-999


Variance slope @ 1 km

5

Variance slope @ 2 km

7

Variance slope @ 5 km

15

Variance slope @ 10 km

-999

Variance slope @ 20 km

-999


NDVI (max. NDVI composite)


Roman et al. (2009) index


St

2.70553855298

Rcv

0.21697677986

Rse

0.0

Rst

-2.42716989732e-07

Rsv

-0.891859514495


NDVI range @ 1km [-]

0.02

NDVI range @ 2km [-]

0.11

NDVI range @ 5km [-]

0.2

NDVI range @ 10km [-]

0.16

NDVI range @ 20km [-]

0.15


Variance slope @ 1 km

0.000192319865793

Variance slope @ 2 km

0.0002229779943

Variance slope @ 5 km

0.000255682562825

Variance slope @ 10 km

0.000197994844502

Variance slope @ 20 km

0.000153596729507


NDVI (min. NDVI composite)I


Roman et al. (2009) index


St

2.06157156202

Rcv

0.361480336558

Rse

0.0

Rst

-0.0937202918737

Rsv

-0.999999887167


NDVI range @ 1km [-]

0.01

NDVI range @ 2km [-]

0.02

NDVI range @ 5km [-]

0.04

NDVI range @ 10km [-]

0.04

NDVI range @ 20km [-]

0.04


NDVI slope @ 1 km

1.53661905207e-05

NDVI slope @ 2 km

1.7106442042e-05

NDVI slope @ 5 km

1.78993468074e-05

NDVI slope @ 10 km

1.44524787022e-05

NDVI slope @ 20 km

1.22423960527e-05


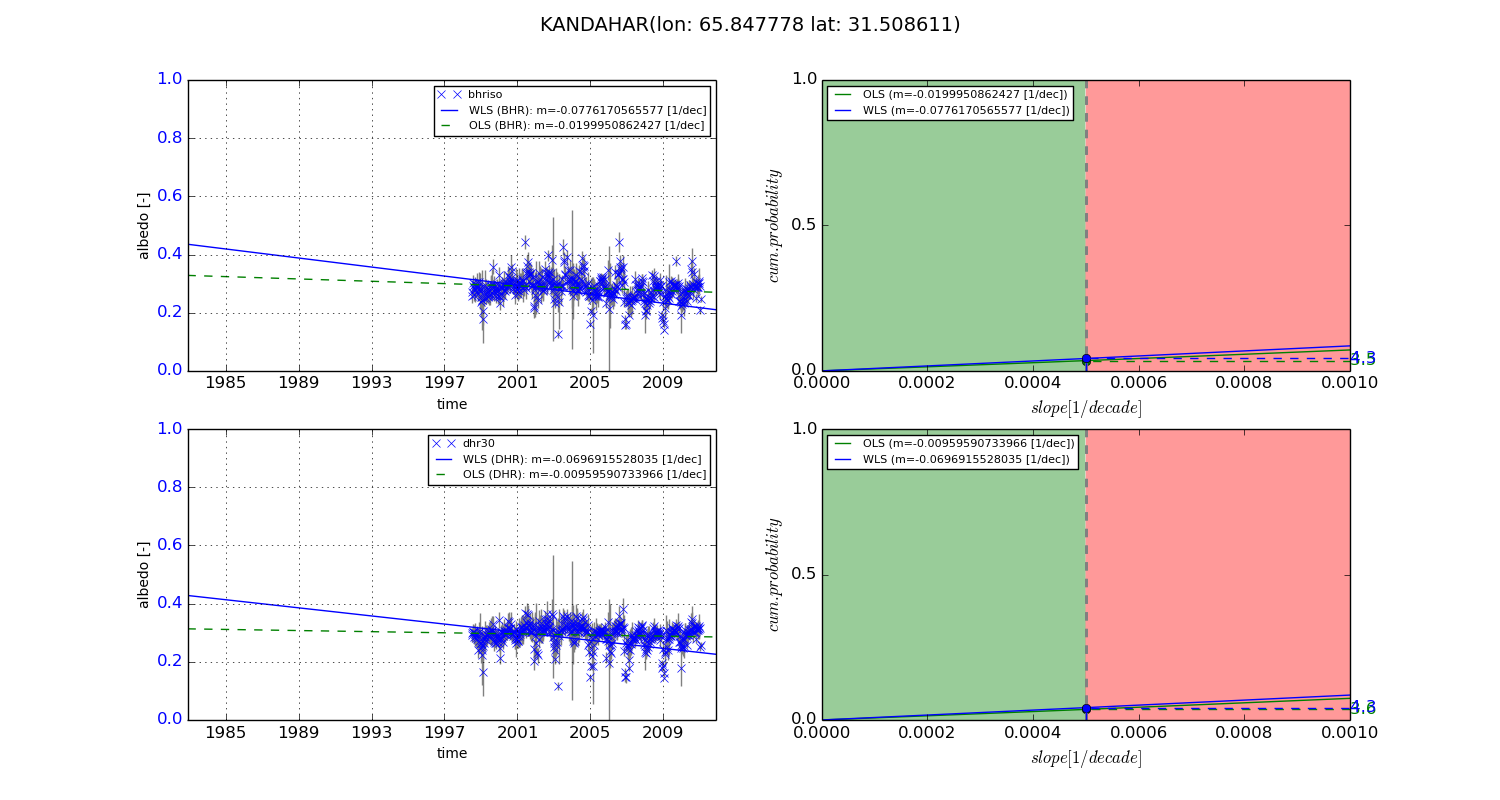
Temporal stability analysis

+000 deg (BHR)


BHR statistics

Temporal stability [1/decade]:


abs

rel


Weighted least square:

-99999.0


Ordinary least square:

-99999.0


Probabilities that GCOS criteria is met:

Weighted least square:

-99999.0 %

Ordinary least square:

-99999.0 %


DHR statistics

Temporal stability [1/decade]:


abs

rel


Weighted least square:

-99999.0


Ordinary least square:

-99999.0


Probabilities that GCOS criteria is met:

Weighted least square:

-99999.0 %

Ordinary least square:

-99999.0 %


+057/+063 deg (BHR)


BHR statistics

Temporal stability [1/decade]:


abs

rel


Weighted least square:

-0.0776170565577


Ordinary least square:

-0.0199950862427


Probabilities that GCOS criteria is met:

Weighted least square:

4.3 %

Ordinary least square:

3.5 %


DHR statistics

Temporal stability [1/decade]:


abs

rel


Weighted least square:

-0.0696915528035


Ordinary least square:

-0.00959590733966


Probabilities that GCOS criteria is met:

Weighted least square:

4.3 %

Ordinary least square:

3.6 %


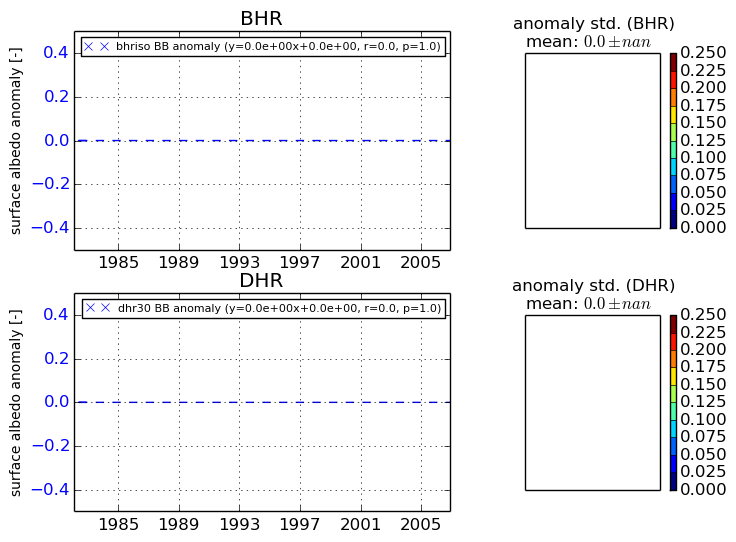
Temporal anomaly analyis

The variance of the temporal anomalies provides an additional measure about the stability of the signal AFTER removal of the mean seasonal cylce.
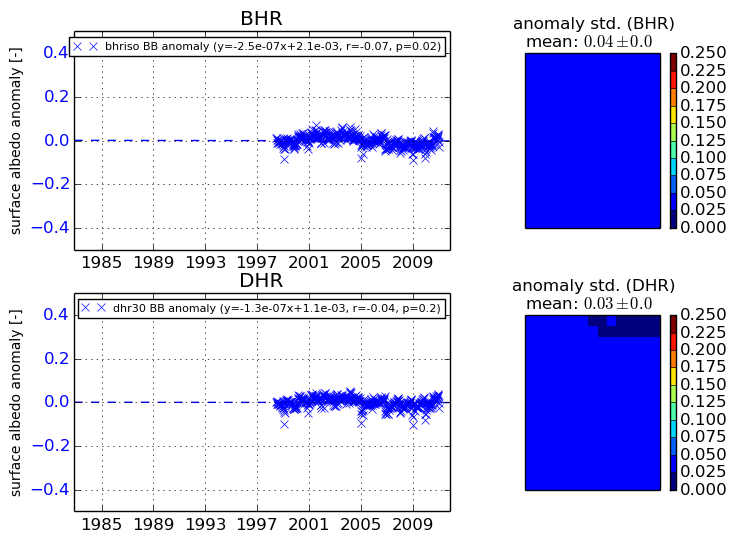
+000 deg


+057/+063 deg