KANGERLUSSUAQ


Location

lon / lat [deg]: -50.6214 / 66.9958

Source network: AERONET


Geostationary surface albedo (GSA) data


“+000”


“+057/+063”


Landcover information (based on ESA CCI landcover data)


Landcover fractions @ 2km distance


Landcover fractions @ 20 km distance


Legend


Distance to open water bodies [km]:

1.27

Distance to urban areas [km]:

none in region


Radius: 1 km

Number of landcover classes:

2

Dominant landcover type:

120: Shrubland

Fraction of dominant landcover type [%]:

83.0


Radius: 2 km

Number of landcover classes:

3

Dominant landcover type:

130: grassland

Fraction of dominant landcover type [%]:

54.0


Radius: 5 km

Number of landcover classes:

4

Dominant landcover type:

130: grassland

Fraction of dominant landcover type [%]:

47.0


Radius: 10 km

Number of landcover classes:

4

Dominant landcover type:

130: grassland

Fraction of dominant landcover type [%]:

47.0


Radius: 20 km

Number of landcover classes:

4

Dominant landcover type:

130: grassland

Fraction of dominant landcover type [%]:

50.0


Disturbances


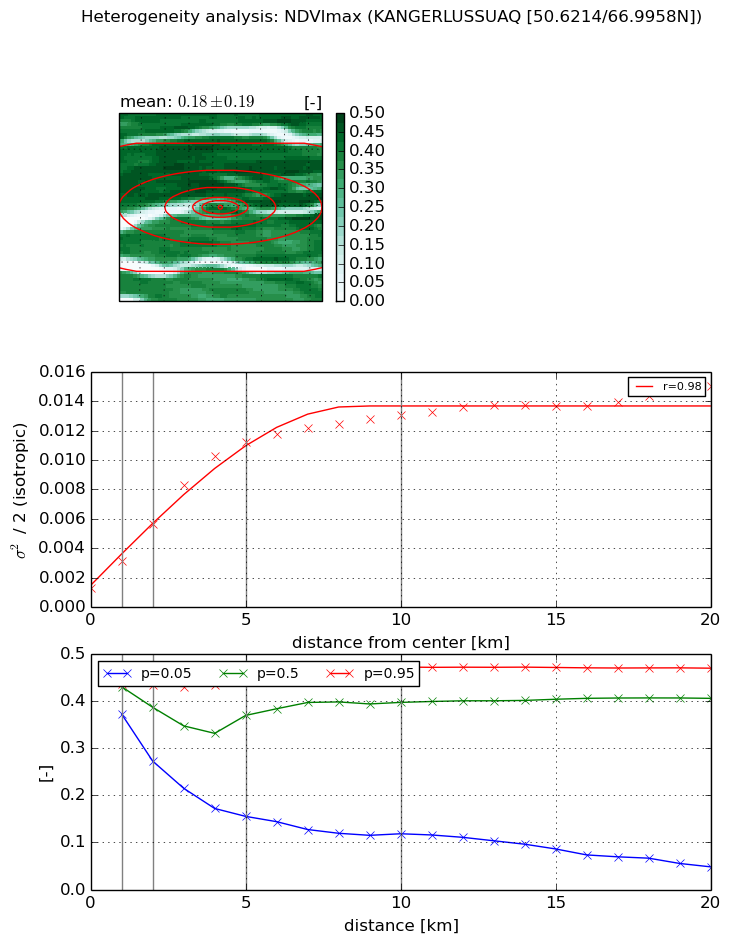
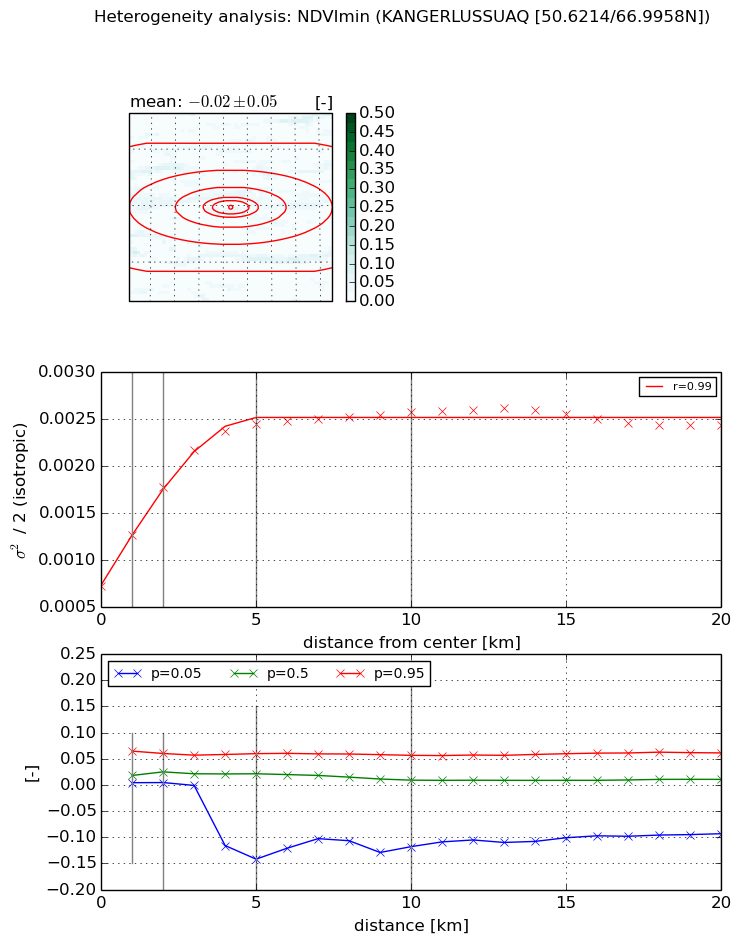
Heterogeneity analysis

The heterogeneity analysis provides information about the spatial and temporal heterogeneity of the site.

Topography


Roman et al. (2009) index


St

1.810018113

Rcv

0.33149659756

Rse

0.0

Rst

-2.00799603629e-08

Rsv

1.32594535957


Height range @ 1km [m]

81

Height range @ 2km [m]

126

Height range @ 5km [m]

247

Height range @ 10km [m]

-999

Height range @ 20km [m]

-999


Variance slope @ 1 km

1086

Variance slope @ 2 km

1576

Variance slope @ 5 km

1392

Variance slope @ 10 km

-999

Variance slope @ 20 km

-999


NDVI (max. NDVI composite)


Roman et al. (2009) index


St

1.41610555439

Rcv

0.475238346565

Rse

0.0

Rst

0.115410450734

Rsv

1.52783734994


NDVI range @ 1km [-]

0.06

NDVI range @ 2km [-]

0.16

NDVI range @ 5km [-]

0.3

NDVI range @ 10km [-]

0.35

NDVI range @ 20km [-]

0.42


Variance slope @ 1 km

0.00184696928551

Variance slope @ 2 km

0.00218356967592

Variance slope @ 5 km

0.0021071736531

Variance slope @ 10 km

0.00115163654725

Variance slope @ 20 km

0.000517627891391


NDVI (min. NDVI composite)I


Roman et al. (2009) index


St

0.16590392499

Rcv

12.3892214896

Rse

0.0

Rst

-0.463448914153

Rsv

5.23008442064


NDVI range @ 1km [-]

0.06

NDVI range @ 2km [-]

0.06

NDVI range @ 5km [-]

0.2

NDVI range @ 10km [-]

0.17

NDVI range @ 20km [-]

0.15


NDVI slope @ 1 km

0.000540701703244

NDVI slope @ 2 km

0.000523752552852

NDVI slope @ 5 km

0.000352848280146

NDVI slope @ 10 km

0.000157732198053

NDVI slope @ 20 km

4.8317067608e-05


Temporal stability analysis

+000 deg (BHR)


BHR statistics

Temporal stability [1/decade]:


abs

rel


Weighted least square:

-99999.0


Ordinary least square:

-99999.0


Probabilities that GCOS criteria is met:

Weighted least square:

-99999.0 %

Ordinary least square:

-99999.0 %


DHR statistics

Temporal stability [1/decade]:


abs

rel


Weighted least square:

-99999.0


Ordinary least square:

-99999.0


Probabilities that GCOS criteria is met:

Weighted least square:

-99999.0 %

Ordinary least square:

-99999.0 %


+057/+063 deg (BHR)


BHR statistics

Temporal stability [1/decade]:


abs

rel


Weighted least square:

None


Ordinary least square:

None


Probabilities that GCOS criteria is met:

Weighted least square:

None %

Ordinary least square:

None %


DHR statistics

Temporal stability [1/decade]:


abs

rel


Weighted least square:

None


Ordinary least square:

None


Probabilities that GCOS criteria is met:

Weighted least square:

None %

Ordinary least square:

None %


Temporal anomaly analyis

The variance of the temporal anomalies provides an additional measure about the stability of the signal AFTER removal of the mean seasonal cylce.

+000 deg


+057/+063 deg