KANZELHOHE_OBS


Location

lon / lat [deg]: 13.907 / 46.678

Source network: AERONET


Geostationary surface albedo (GSA) data


“+000”


“+057/+063”


Landcover information (based on ESA CCI landcover data)


Landcover fractions @ 2km distance


Landcover fractions @ 20 km distance


Legend


Distance to open water bodies [km]:

1.73

Distance to urban areas [km]:

1.77


Radius: 1 km

Number of landcover classes:

3

Dominant landcover type:

70: Tree cover, needleleaved, evergreen, closed to open (>15%)

Fraction of dominant landcover type [%]:

85.0


Radius: 2 km

Number of landcover classes:

8

Dominant landcover type:

70: Tree cover, needleleaved, evergreen, closed to open (>15%)

Fraction of dominant landcover type [%]:

67.0


Radius: 5 km

Number of landcover classes:

8

Dominant landcover type:

70: Tree cover, needleleaved, evergreen, closed to open (>15%)

Fraction of dominant landcover type [%]:

50.0


Radius: 10 km

Number of landcover classes:

9

Dominant landcover type:

70: Tree cover, needleleaved, evergreen, closed to open (>15%)

Fraction of dominant landcover type [%]:

45.0


Radius: 20 km

Number of landcover classes:

9

Dominant landcover type:

70: Tree cover, needleleaved, evergreen, closed to open (>15%)

Fraction of dominant landcover type [%]:

45.0


Disturbances


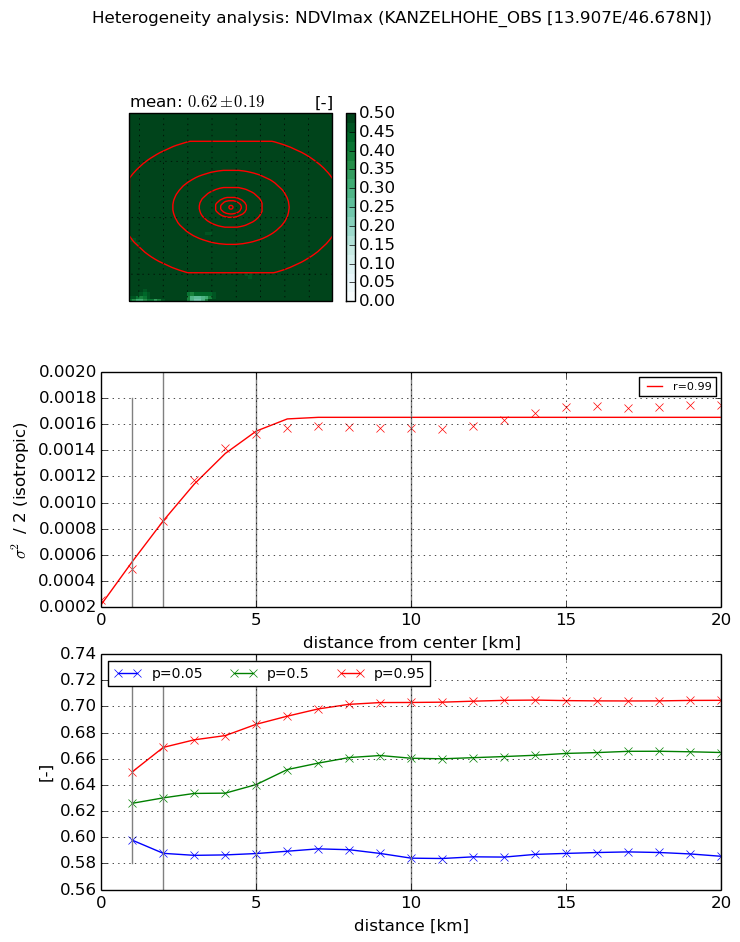
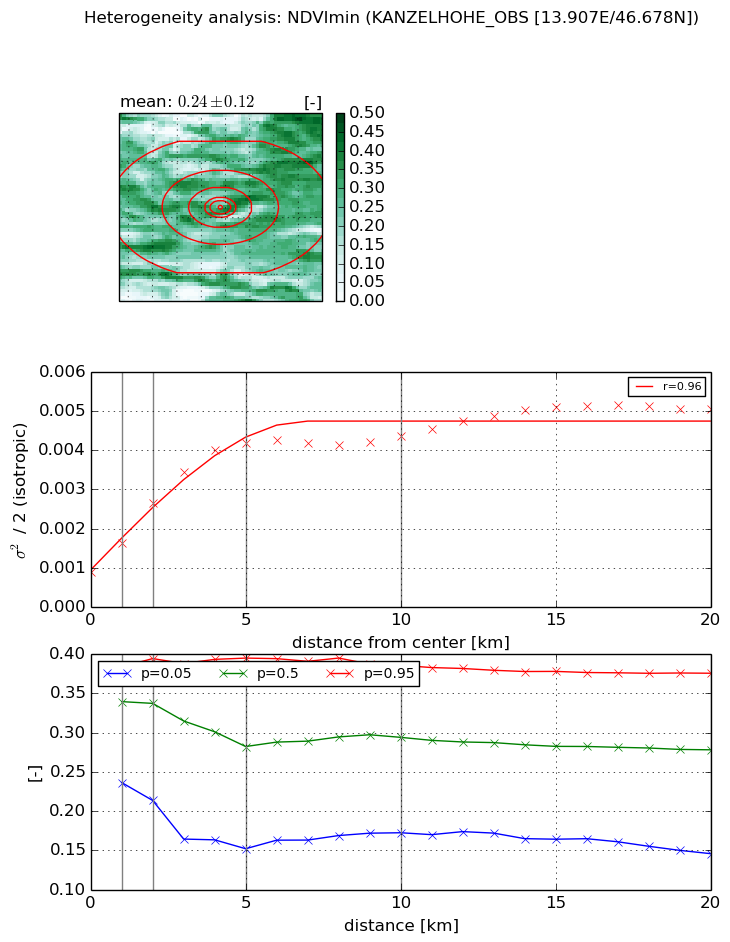
Heterogeneity analysis

The heterogeneity analysis provides information about the spatial and temporal heterogeneity of the site.

Topography


Roman et al. (2009) index


St

11.7632019451

Rcv

-0.0212539475361

Rse

0.0

Rst

-0.0167830840154

Rsv

-0.216995570456


Height range @ 1km [m]

1078

Height range @ 2km [m]

1252

Height range @ 5km [m]

1169

Height range @ 10km [m]

-999

Height range @ 20km [m]

-999


Variance slope @ 1 km

34470

Variance slope @ 2 km

41173

Variance slope @ 5 km

41502

Variance slope @ 10 km

-999

Variance slope @ 20 km

-999


NDVI (max. NDVI composite)


Roman et al. (2009) index


St

21.482657022

Rcv

0.0297430214682

Rse

0.0

Rst

0.00482447291629

Rsv

-0.105080036036


NDVI range @ 1km [-]

0.05

NDVI range @ 2km [-]

0.08

NDVI range @ 5km [-]

0.1

NDVI range @ 10km [-]

0.12

NDVI range @ 20km [-]

0.12


Variance slope @ 1 km

0.000238521144494

Variance slope @ 2 km

0.000302763663454

Variance slope @ 5 km

0.000270044913548

Variance slope @ 10 km

0.000127873429366

Variance slope @ 20 km

5.27719392388e-05


NDVI (min. NDVI composite)I


Roman et al. (2009) index


St

8.23477531775

Rcv

0.107507535982

Rse

0.0

Rst

-0.0507212120991

Rsv

0.206079916605


NDVI range @ 1km [-]

0.15

NDVI range @ 2km [-]

0.18

NDVI range @ 5km [-]

0.24

NDVI range @ 10km [-]

0.21

NDVI range @ 20km [-]

0.23


NDVI slope @ 1 km

0.000750336251552

NDVI slope @ 2 km

0.000880027409466

NDVI slope @ 5 km

0.000695971774783

NDVI slope @ 10 km

0.000306930893588

NDVI slope @ 20 km

0.000158456645558


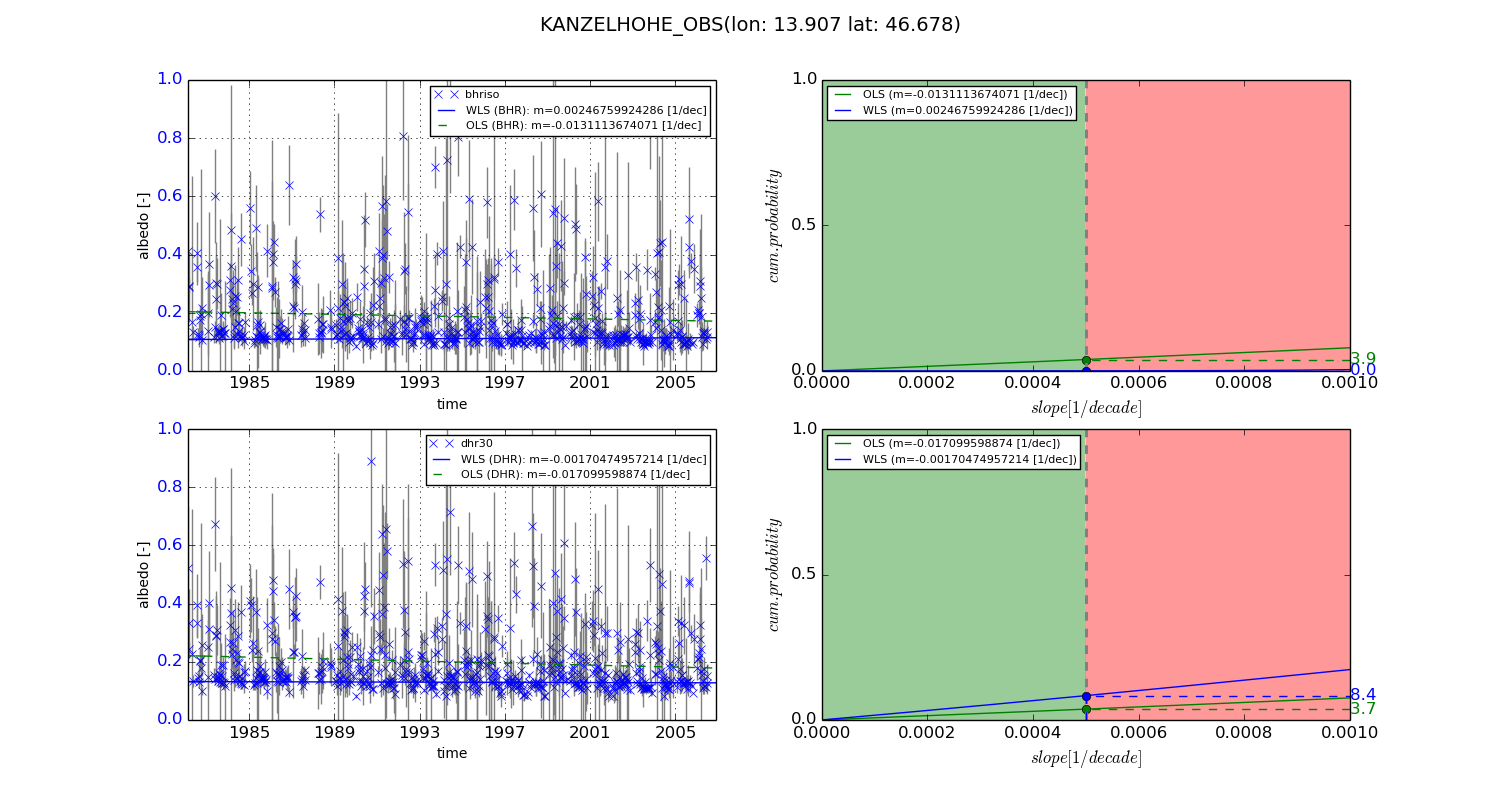
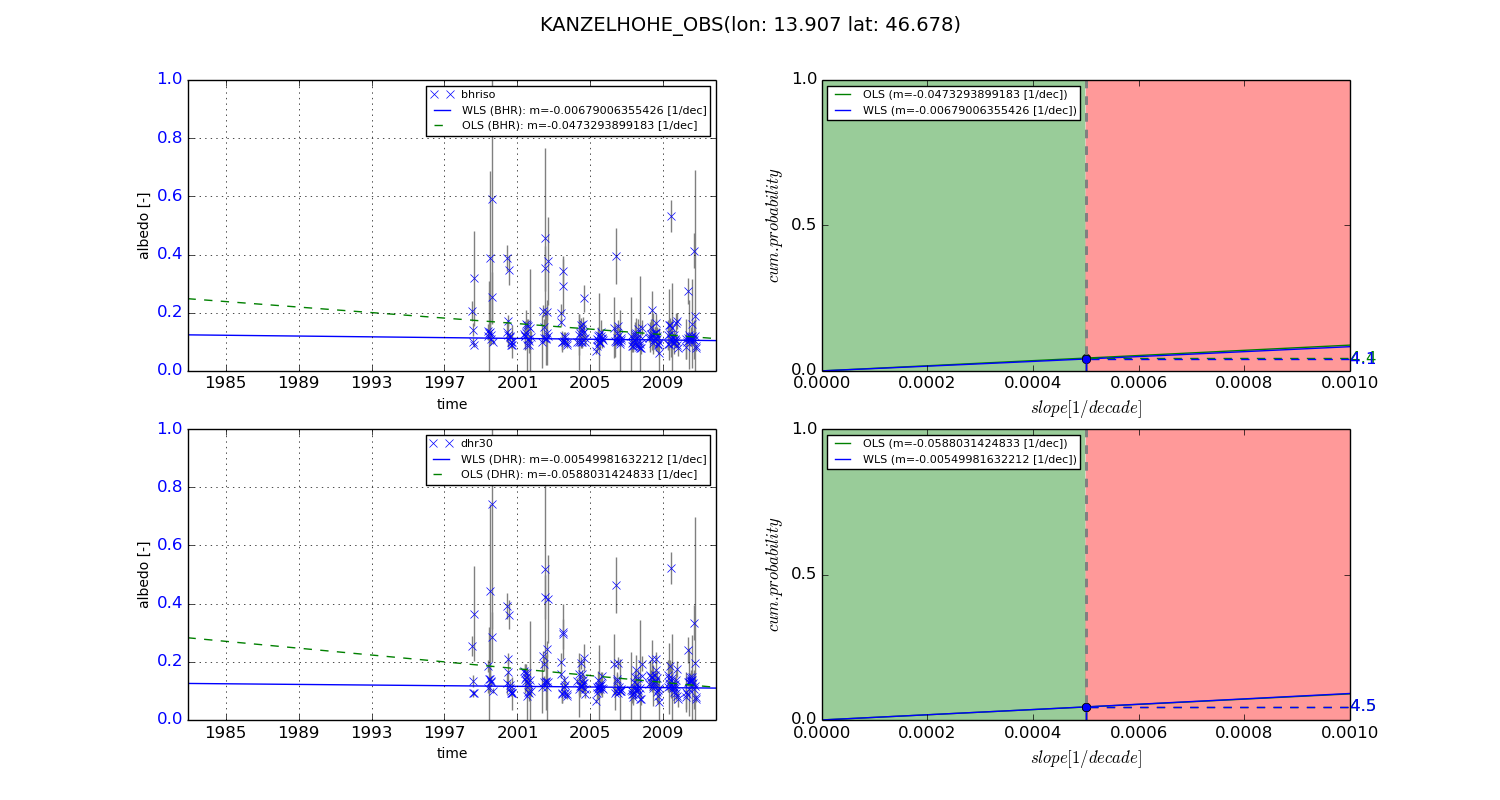
Temporal stability analysis

+000 deg (BHR)


BHR statistics

Temporal stability [1/decade]:


abs

rel


Weighted least square:

0.00246759924286


Ordinary least square:

-0.0131113674071


Probabilities that GCOS criteria is met:

Weighted least square:

0.0 %

Ordinary least square:

3.9 %


DHR statistics

Temporal stability [1/decade]:


abs

rel


Weighted least square:

-0.00170474957214


Ordinary least square:

-0.017099598874


Probabilities that GCOS criteria is met:

Weighted least square:

8.4 %

Ordinary least square:

3.7 %


+057/+063 deg (BHR)


BHR statistics

Temporal stability [1/decade]:


abs

rel


Weighted least square:

-0.00679006355426


Ordinary least square:

-0.0473293899183


Probabilities that GCOS criteria is met:

Weighted least square:

4.1 %

Ordinary least square:

4.4 %


DHR statistics

Temporal stability [1/decade]:


abs

rel


Weighted least square:

-0.00549981632212


Ordinary least square:

-0.0588031424833


Probabilities that GCOS criteria is met:

Weighted least square:

4.5 %

Ordinary least square:

4.5 %


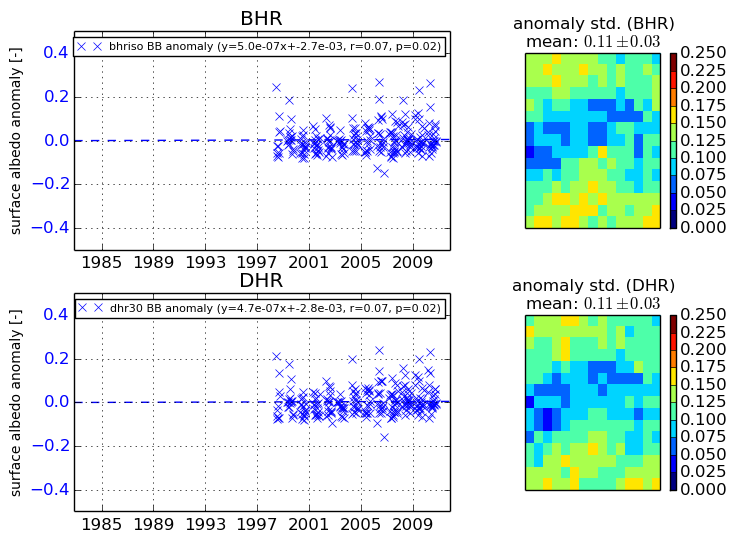
Temporal anomaly analyis

The variance of the temporal anomalies provides an additional measure about the stability of the signal AFTER removal of the mean seasonal cylce.
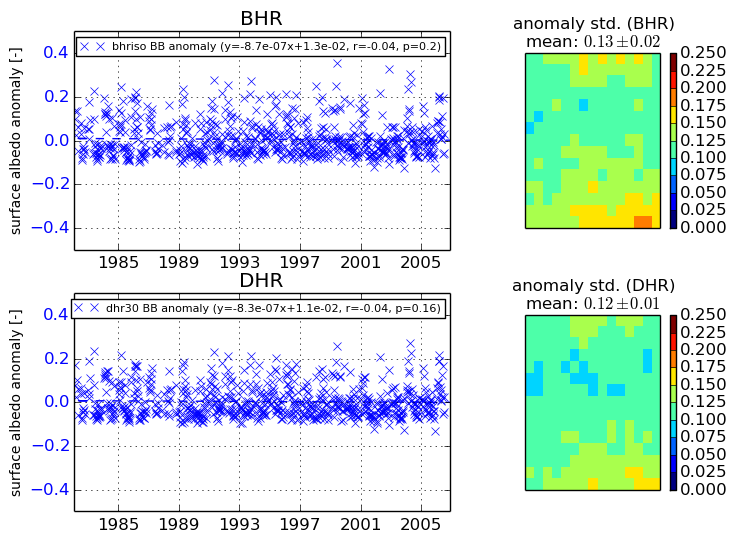
+000 deg


+057/+063 deg


By continuing to use this website, you are giving consent to analytic cookies being used. For more information on how EUMETSAT uses data and how you can disable this, please view this web page: Analytics Cookie Policy