KARAKORUM_BIAFO


Location

lon / lat [deg]: 75.63 / 36.06

Source network: ALBEDOVAL2


Geostationary surface albedo (GSA) data


“+000”


“+057/+063”


Landcover information (based on ESA CCI landcover data)


Landcover fractions @ 2km distance


Landcover fractions @ 20 km distance


Legend


Distance to open water bodies [km]:

22.49

Distance to urban areas [km]:

24.75


Radius: 1 km

Number of landcover classes:

2

Dominant landcover type:

220: permanent snow and ice

Fraction of dominant landcover type [%]:

83.0


Radius: 2 km

Number of landcover classes:

2

Dominant landcover type:

220: permanent snow and ice

Fraction of dominant landcover type [%]:

93.0


Radius: 5 km

Number of landcover classes:

2

Dominant landcover type:

220: permanent snow and ice

Fraction of dominant landcover type [%]:

98.0


Radius: 10 km

Number of landcover classes:

2

Dominant landcover type:

220: permanent snow and ice

Fraction of dominant landcover type [%]:

98.0


Radius: 20 km

Number of landcover classes:

2

Dominant landcover type:

220: permanent snow and ice

Fraction of dominant landcover type [%]:

93.0


Disturbances


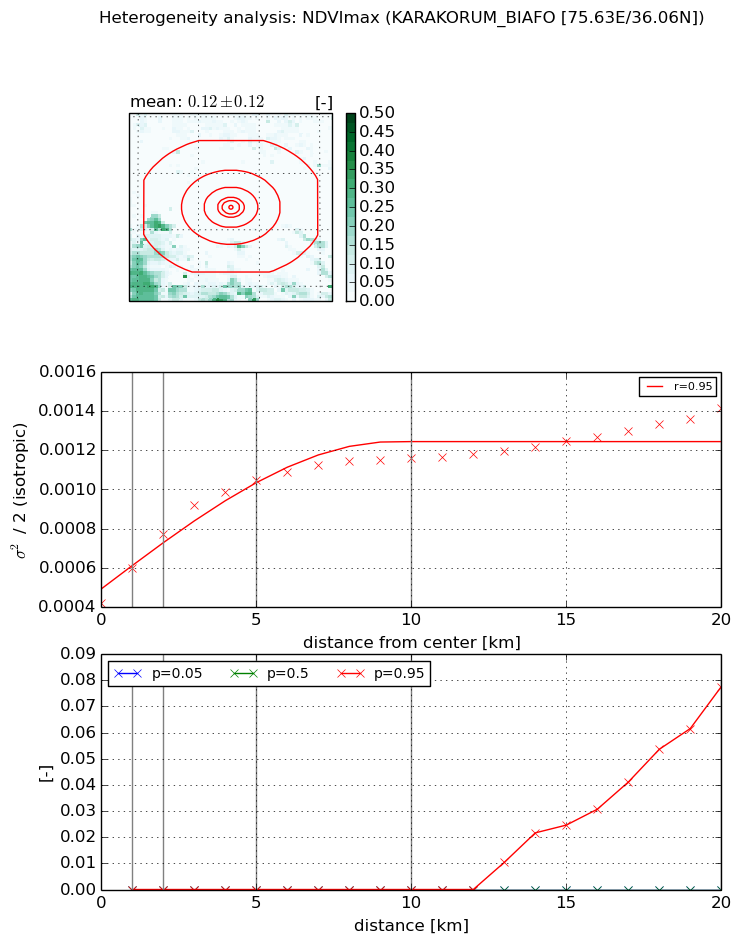
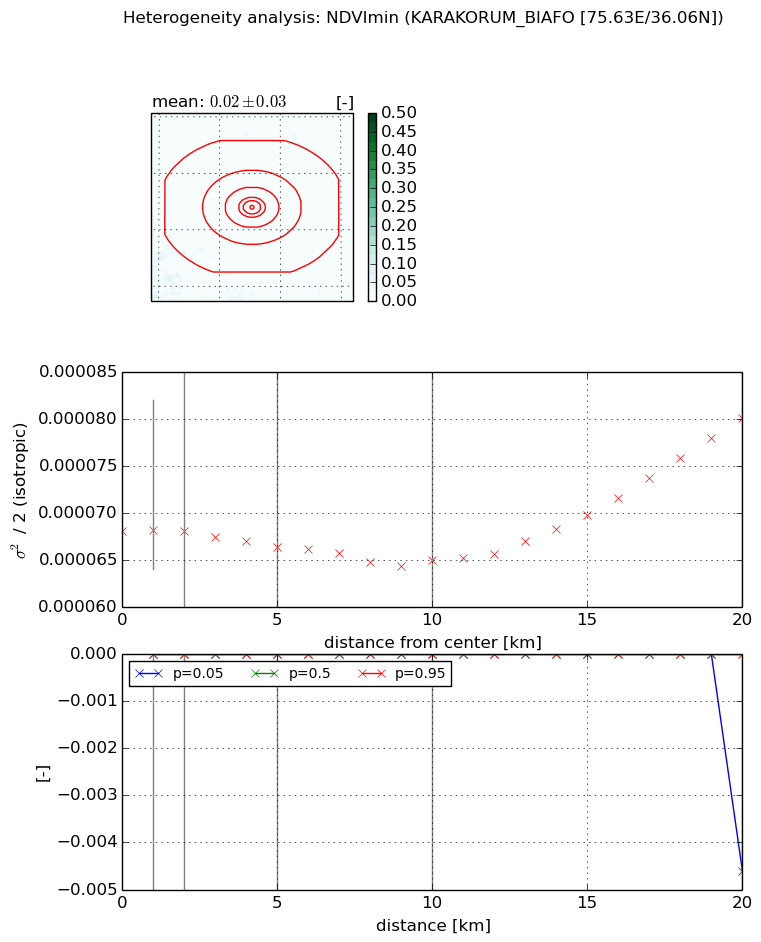
Heterogeneity analysis

The heterogeneity analysis provides information about the spatial and temporal heterogeneity of the site.

Topography


Roman et al. (2009) index


St

3.88985203582

Rcv

0.140987004013

Rse

0.0

Rst

-0.114326460888

Rsv

0.515924096932


Height range @ 1km [m]

566

Height range @ 2km [m]

665

Height range @ 5km [m]

710

Height range @ 10km [m]

-999

Height range @ 20km [m]

-999


Variance slope @ 1 km

15932

Variance slope @ 2 km

15010

Variance slope @ 5 km

11338

Variance slope @ 10 km

-999

Variance slope @ 20 km

-999


NDVI (max. NDVI composite)


Roman et al. (2009) index


St

nan

Rcv

nan

Rse

nan

Rst

nan

Rsv

nan


NDVI range @ 1km [-]

0.0

NDVI range @ 2km [-]

0.0

NDVI range @ 5km [-]

0.0

NDVI range @ 10km [-]

0.0

NDVI range @ 20km [-]

0.08


Variance slope @ 1 km

0.000179906230839

Variance slope @ 2 km

0.000176465385114

Variance slope @ 5 km

0.000127644407143

Variance slope @ 10 km

6.83267609451e-05

Variance slope @ 20 km

3.55611804971e-05


NDVI (min. NDVI composite)I


Roman et al. (2009) index


St

nan

Rcv

nan

Rse

nan

Rst

nan

Rsv

nan


NDVI range @ 1km [-]

0.0

NDVI range @ 2km [-]

0.0

NDVI range @ 5km [-]

0.0

NDVI range @ 10km [-]

0.0

NDVI range @ 20km [-]

0.0


NDVI slope @ 1 km

9.78443322695e-08

NDVI slope @ 2 km

-9.06892965144e-09

NDVI slope @ 5 km

-3.67507732799e-07

NDVI slope @ 10 km

-4.10439973945e-07

NDVI slope @ 20 km

4.83704953875e-07


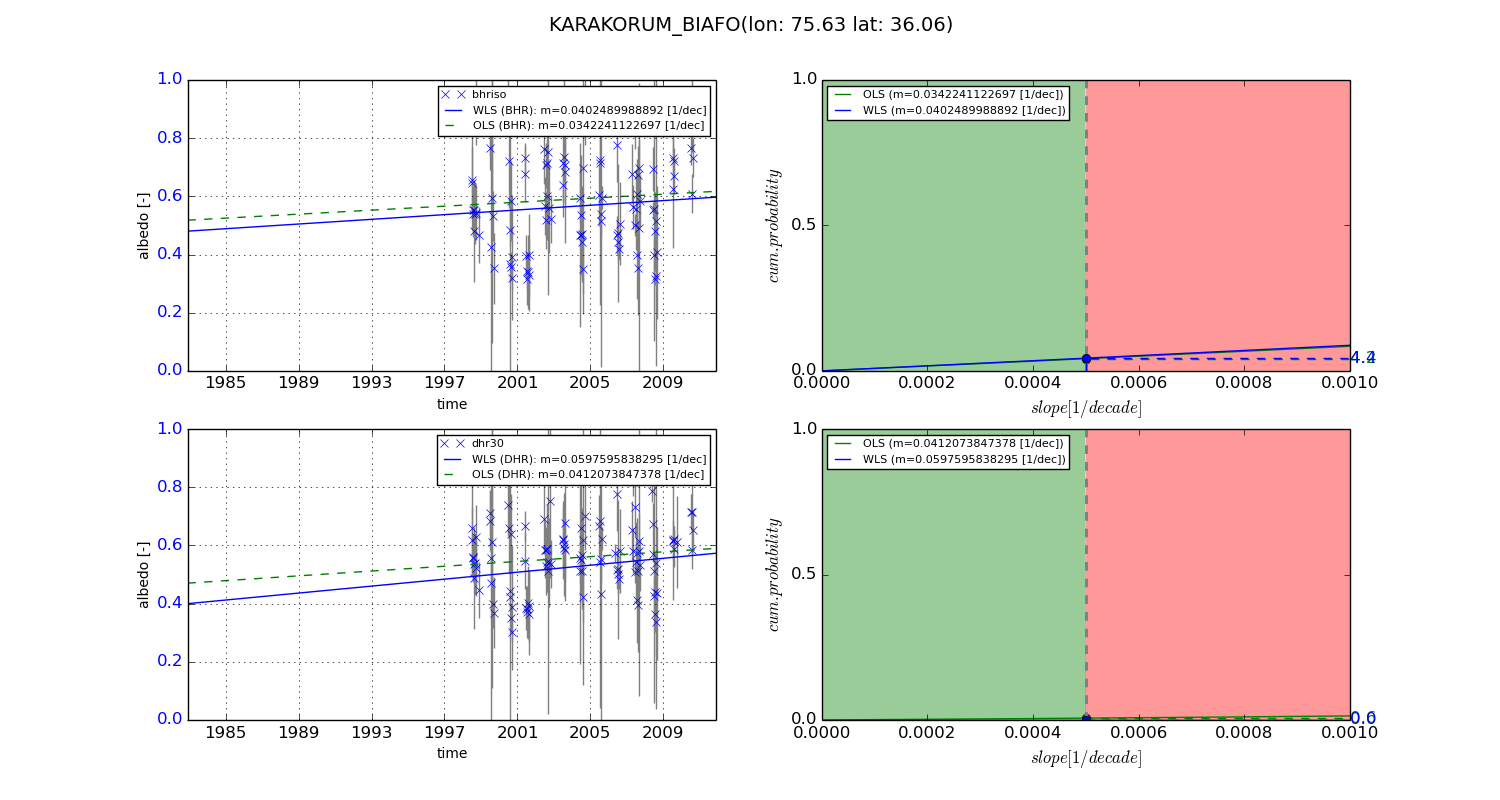
Temporal stability analysis

+000 deg (BHR)


BHR statistics

Temporal stability [1/decade]:


abs

rel


Weighted least square:

-99999.0


Ordinary least square:

-99999.0


Probabilities that GCOS criteria is met:

Weighted least square:

-99999.0 %

Ordinary least square:

-99999.0 %


DHR statistics

Temporal stability [1/decade]:


abs

rel


Weighted least square:

-99999.0


Ordinary least square:

-99999.0


Probabilities that GCOS criteria is met:

Weighted least square:

-99999.0 %

Ordinary least square:

-99999.0 %


+057/+063 deg (BHR)


BHR statistics

Temporal stability [1/decade]:


abs

rel


Weighted least square:

0.0402489988892


Ordinary least square:

0.0342241122697


Probabilities that GCOS criteria is met:

Weighted least square:

4.4 %

Ordinary least square:

4.2 %


DHR statistics

Temporal stability [1/decade]:


abs

rel


Weighted least square:

0.0597595838295


Ordinary least square:

0.0412073847378


Probabilities that GCOS criteria is met:

Weighted least square:

0.0 %

Ordinary least square:

0.6 %


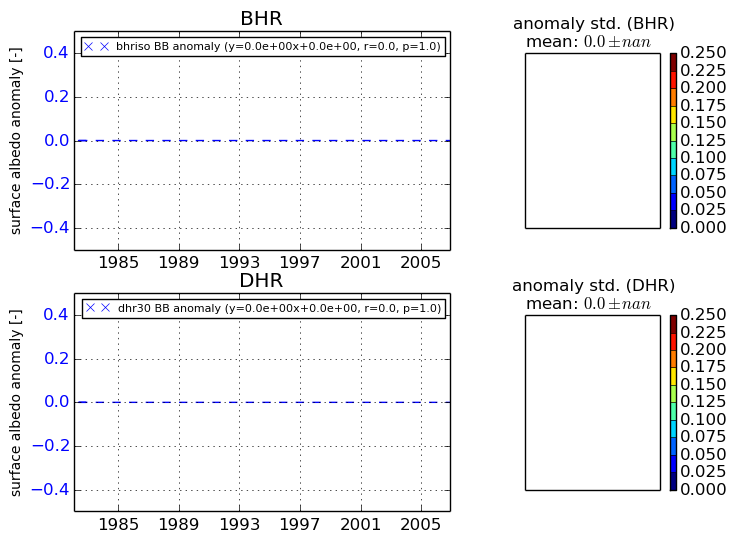
Temporal anomaly analyis

The variance of the temporal anomalies provides an additional measure about the stability of the signal AFTER removal of the mean seasonal cylce.
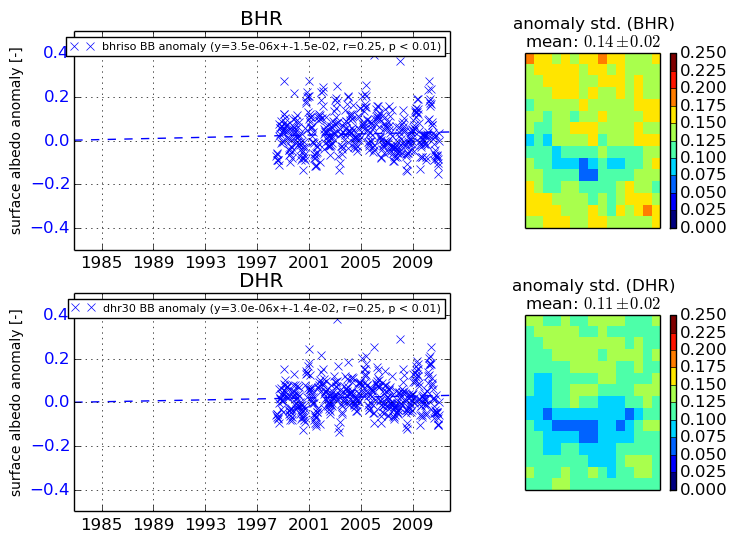
+000 deg


+057/+063 deg